GLD…Break Out Day


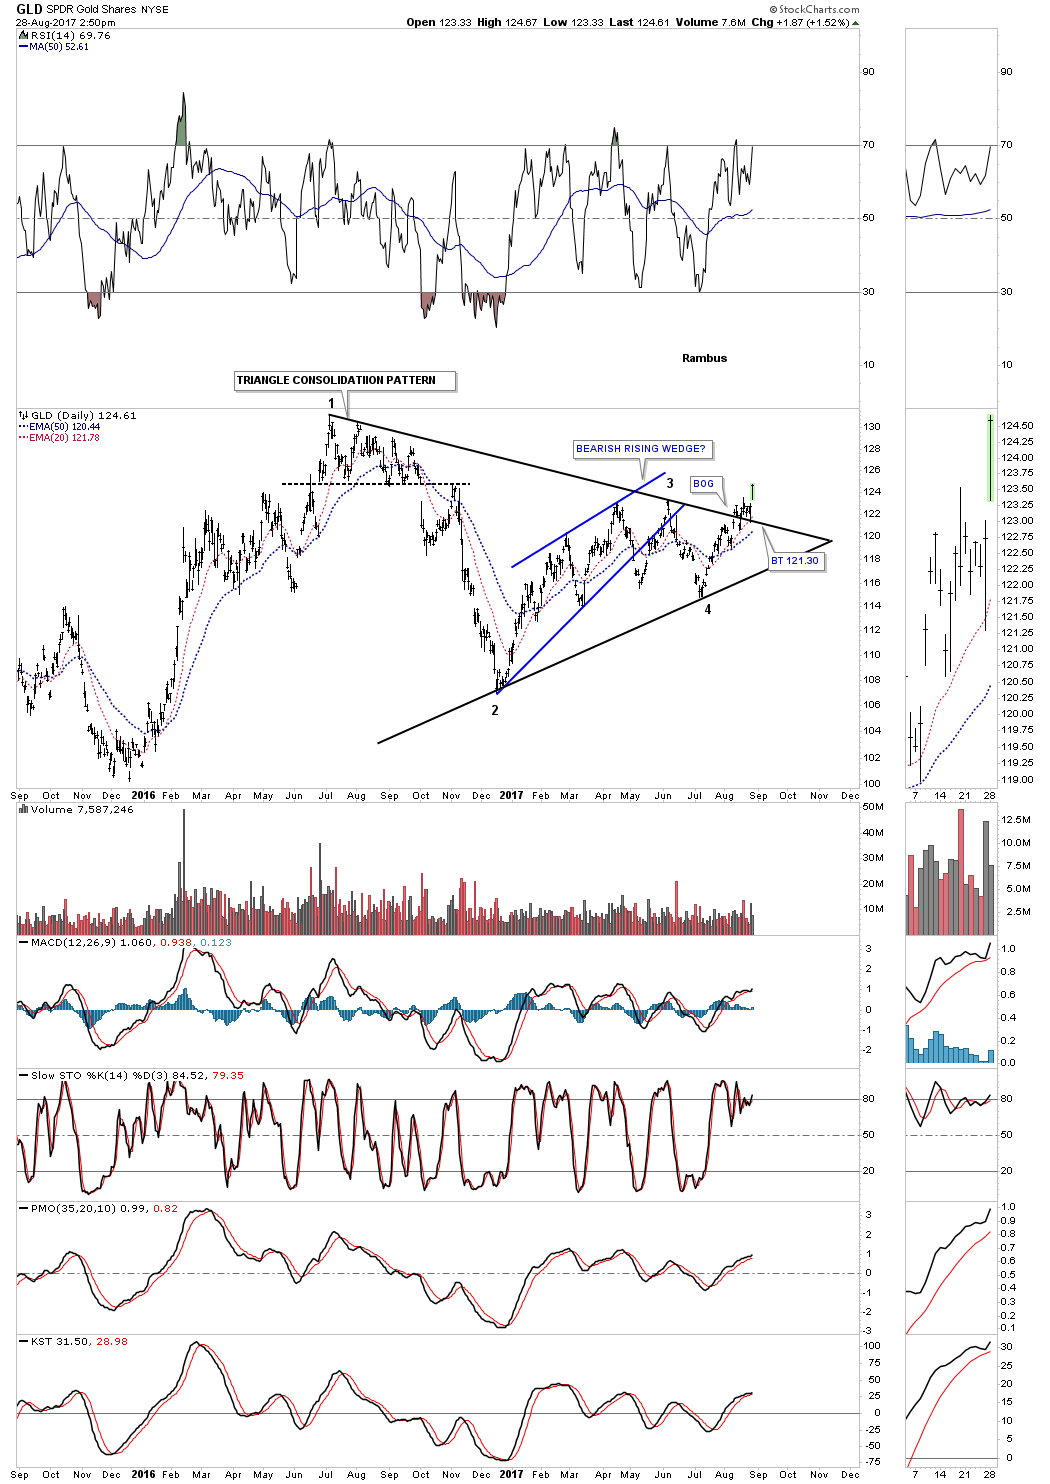
Below is a short-term daily chart for GLD which shows it breaking out above the top rail of the blue expanding triangle today.

The longer-term 2-year daily chart shows GLD breaking out and backtesting the top rail of the triangle consolidation pattern. It looks like all the work is now finished with the breaking out and backtesting process.
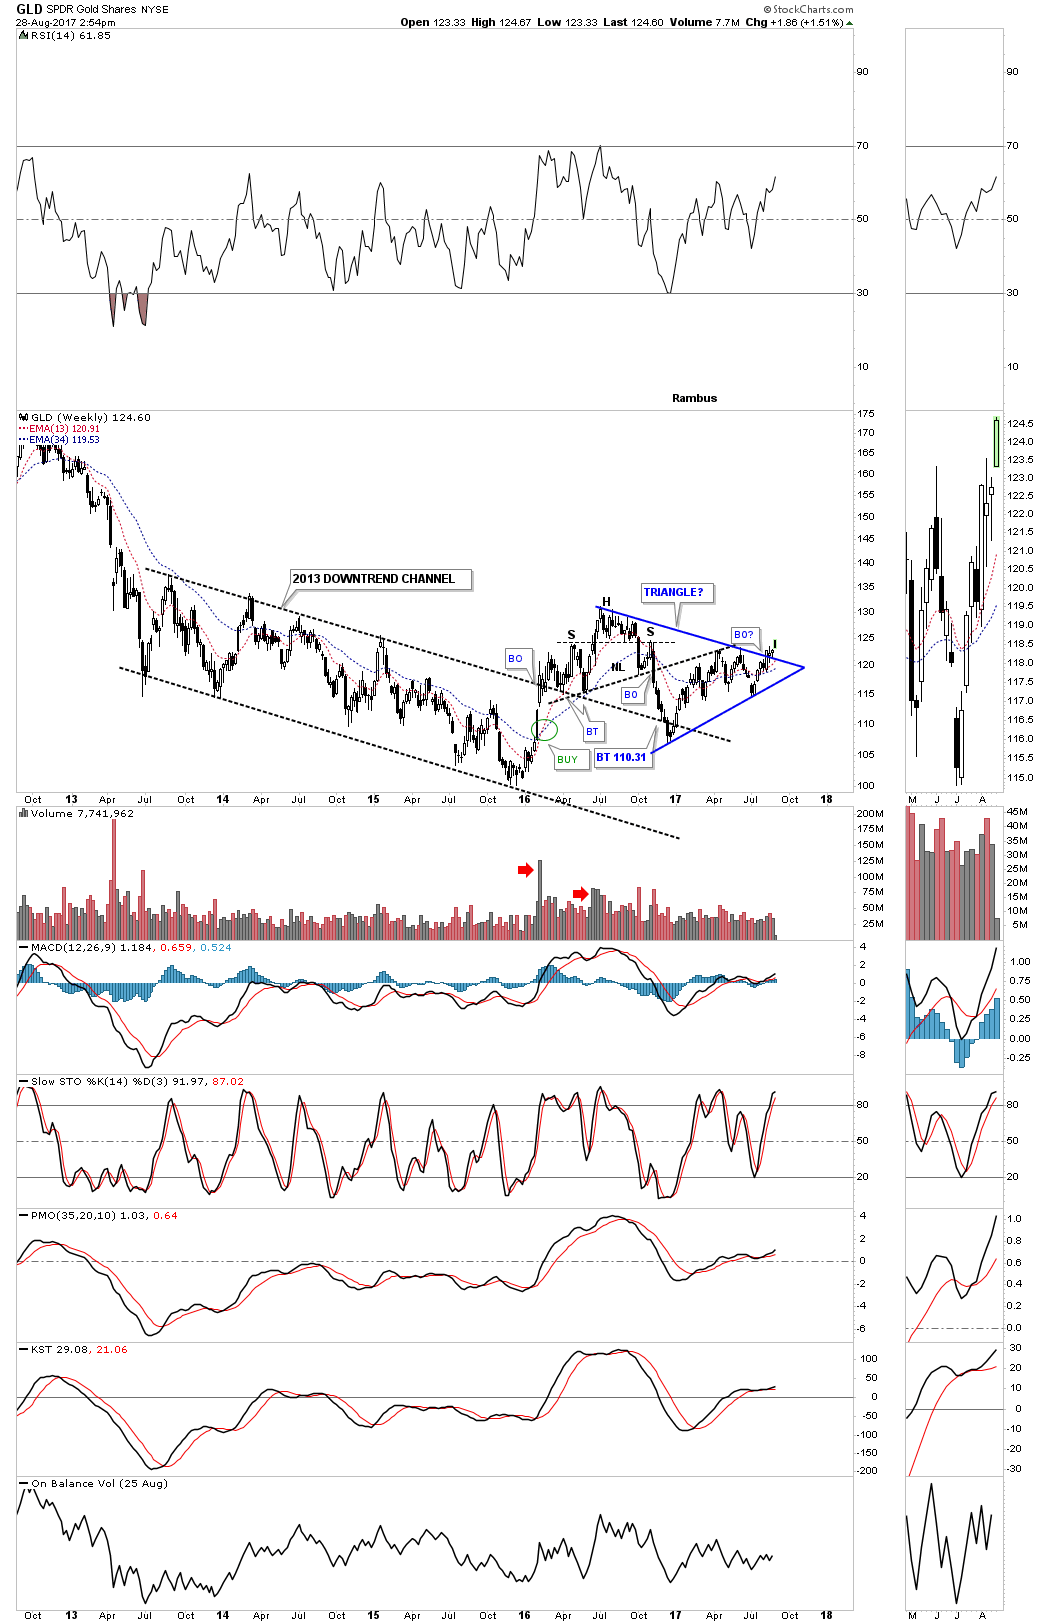
Below is the 5-year weekly chart for perspective.
********
 Meet Rambus, a seasoned trader and technical analyst renowned for his unbiased and insightful chart work. Through his website, Rambus Chartology, and Substack newsletter, Rambus shares his expertise with a global community of subscribers, providing daily updates, commentaries, and hands-on training in the art and science of chartology. With his calm, humble, and down-to-earth approach, Rambus demystifies complex market trends, helping his followers navigate the challenges of today's volatile markets. Join the Rambus Chartology community today and discover a unique blend of technical analysis, trading expertise, and time-tested protocols. Subscribe now at www.rambus1.com or https://rambuschartology.substack.com/


