Global Gold Investment Demand To Overwhelm Supply During Next Market Crash
 share
share
 share
share
 share
share
 share
share
 share
share
When the next market crash occurs, global gold investment demand will likely overwhelm supply. When this occurs, we could finally see the gold price surpass its previous high of $1,900. Now, this isn’t mere speculation, as we already have seen this taking place in the past. When the broader markets crashed to the lows in Q1 2009 and the 10% correction in Q1 in 2016, these periods were to two highest quarters of Gold ETF investment demand.
I don’t really care on whether the physical gold is actually in the Gold ETF’s, rather I like to look at it as an important indicator that shows us how much investor fear there is in the market. Moreover, with the amount of leverage and debt now in the system, when the market crashes this time around, it will push gold investment demand up to a record we have never seen before.
The chart below shows the amount of physical global gold investment demand over the past 14 years. As the gold price increased, so did amount of gold bar and coin demand:
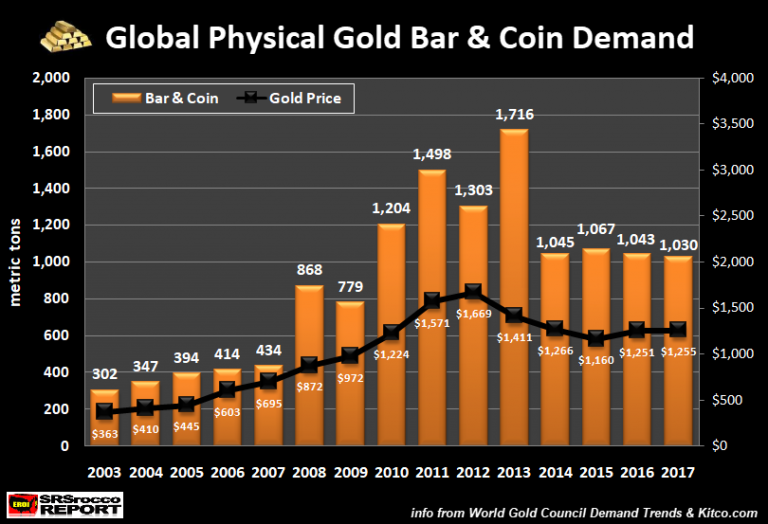
As we can see, during the U.S. Banking and Housing Market crash in 2008, gold bar and coin demand doubled to 868 metric tons (mt), up from 434 mt in 2007. That was quite a lot of gold bar and coin demand as it totaled nearly 28 million oz (1 metric ton = 32,150 oz). Furthermore, as the gold price jumped to $1,571 in 2011, gold bar and coin demand shot up to nearly 1,500 mt (48 million oz).
Now, the reason for the huge spike in physical gold investment in 2013 was due to the huge price smash as the gold price fell from nearly $1,700 in the beginning of the year to a low of $1,380 by the middle of April. Investors thought this was a huge sale on gold so demand for bars and coins reached a new record of 1,716 mt.
However, net gold investment demand in 2013 was only 804 mt because Gold ETF’s experienced a massive outflow of 912 mt. Basically, the gutting of the Gold ETF’s by the gold price takedown allowed investors to purchase that record amount of gold bar and coin. Moreover, Gold ETF flows continue to be negative in 2014 and 2015. Over the three years, (2013-2015) a total of inventory of the world’s Gold ETF’s declined by 1,221 mt. Thus, net global gold investment remained below 1,000 mt from 2013 to 2015.
But, this changed in 2016 when the U.S. stock market experienced a 2,000 point drop during the first quarter. The Dow Jones Index fell from 17,500 in the beginning of January to a low of 15,500 within a month:
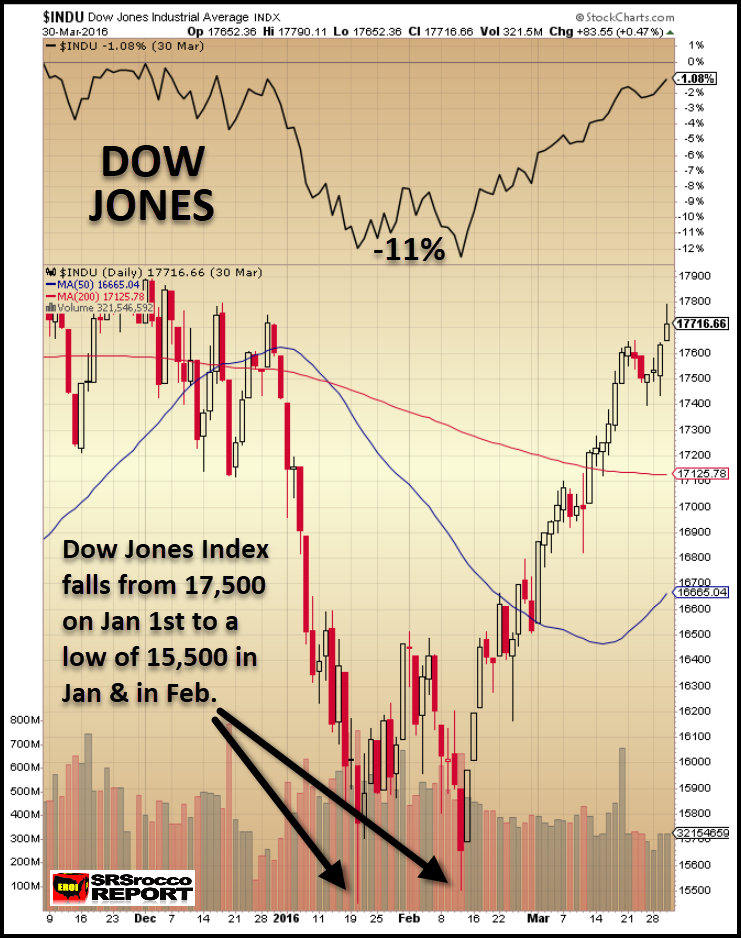
During this first quarter of 2016, Gold ETF inflows spiked to 349 mt, up from a net outflow of 66 mt in Q4 2015. You see, gold continued to flow out of Gold ETF’s right up until the point the market fell 11% in the first quarter of 2016. As I mentioned before, the only other quarter that experienced a higher amount of Gold ETF inflows was the first quarter of 2009 when the Dow Jones was falling precipitously to a low of 6,600 points. Gold ETF inflows surged to 465 mt in Q1 2009 versus 95 mt Q4 2008.
We must understand that investors panicked into gold during a lousy 11% in Q1 2016 in similar fashion to the market meltdown in the first quarter of 2009. Thus, investors are likely to rush into gold to a much larger degree during the next market crash.
Taking these factors into consideration, I produced the following chart:

Now, assuming current market conditions, investors will purchase roughly 1,050 mt of gold bar and coin and 250 mt of Gold ETF’s for a total of 1,300 mt. However, I believe the next big market crash could push global physical gold bar and coin demand to 3,000 mt. This will have a significant impact on the price as available supply vanishes. We could easily see a $2,000 gold price as the stock market crashes by 25-50%.
Again, we have evidence that the gold price surged by $200 when the Dow Jones fell by only 11% in the first quarter of 2016:
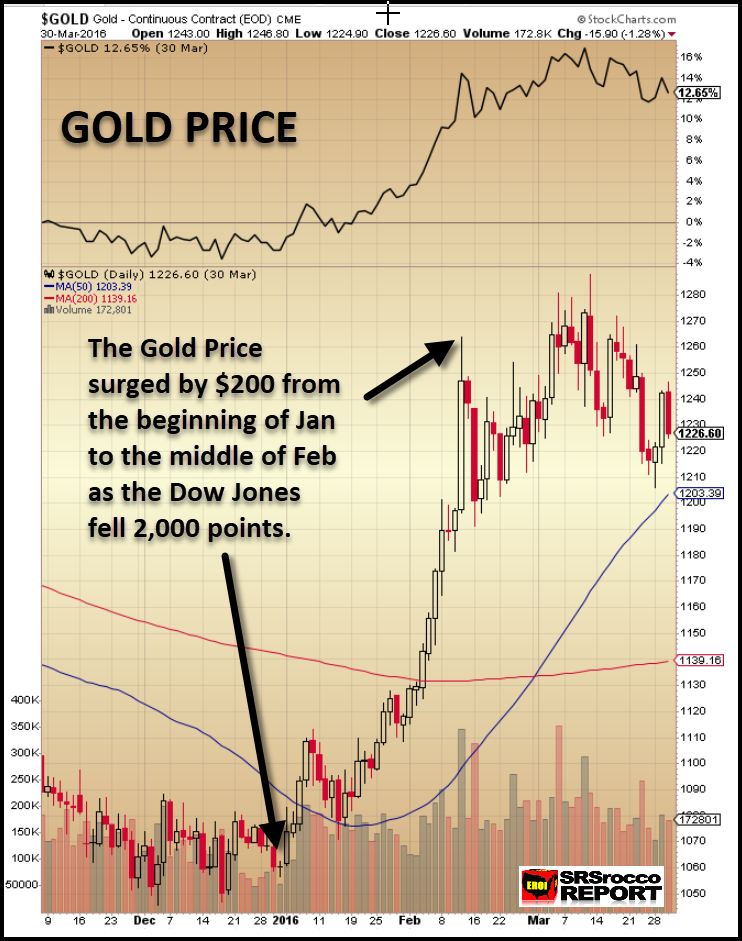
Today, it’s a totally different ballgame. Not only is the gold price almost trading at $1,300, the Dow Jones Index is 6,000 points higher than what it was at the beginning of 2016. If the Dow Jones experienced another severe 10-15% correction, we could easily see gold move up by $200. So, what happens when the markets tank by 25-50%? And what about gold demand?
As I stated above, we could see total gold investment demand surpass 3,000 mt when the stock market crashes. This is bad news because there won’t be the available supply… maybe at much higher prices. Furthermore, the highest annual total net gold investment was 1,730 mt in 2011. This included 1,498 mt of bar and coin as well as 232 mt in Gold ETF demand. But, we must remember, there wasn’t a stock market crisis in 2011. Thus, Gold ETF demand was in the normal range.
Mainstream investors are the wild card. By that, I mean when the markets turn south in a big way, they are going to go totally wild. While physical gold demand in the U.S. is down 50% compared to last year I don’t look at it as being negative, instead it indicates a bottom or low in precious metals sentiment. The situation in the precious metals market can turn around on a dime.
Lastly, when total global gold investment demand surges to 3,000 mt in one year, it will put a great deal of pressure on available supplies. Total global gold annual supply is approximately 4,500 mt. However, we also have to include jewelry (2,000 mt), technology (200 mt), and Central Bank demand (300 mt). So, if we experienced 3,000 mt in total gold investment and added all other demand it would equal 5,500 mt. This would be 1,000 mt more than supply. The highest annual deficit the market experienced was 198 mt in 2013. The world has never suffered a 1,000 mt deficit.
For this reason, Central Banks make sure investors continue to put their funds into the Greatest Paper Ponzi Scheme in history rather than in a very rare precious metal called gold. There is one thing for sure, all Ponzi Schemes collapse, but a 2,000+ year history of sound gold money won’t be forgotten.
Courtesy of SRSrocco Report.
share
share
share
share
share

Independent researcher Steve St. Angelo (SRSrocco) started to invest in precious metals in 2002. Later on in 2008, he began researching areas of the gold and silver market that, curiously, the majority of the precious metal analyst community have left unexplored. These areas include how energy and the falling EROI – Energy Returned On Invested – stand to impact the mining industry, precious metals, paper assets, and the overall economy. He has written scholarly articles in some of the top precious metals and financial websites. Visit his website SRSrocco Report.


