Gold’s Final Warning of Impending Monetary Collapse


Gold is currently trading in excess of $1300 an ounce. This is well above the 1980 all-time high. However, this is an incomplete representation of what gold is trading at relative to US dollars. When you look at the gold price relative to US currency in existence (US Monetary Base), then it is close to the lowest value it has ever been.
This in itself is a major warning regarding the sustainability of the current monetary system. In other words, the monetary system is the most debased it has ever been. Furthermore, not only is the monetary system at an all-time high stress-point, but also, this comes at the worst possible time relative to other key conditions.
Together, these factors will ensure that the outcome of the current monetary distress, will be much worse than any previous ones. There were previous significant monetary stress-points in the early 1930s and 1971. Although the outcomes from those events were very bad, it did not lead to a complete loss of confidence in the system itself.
The extent of the current monetary distress, with all other things considered, is such that it will likely result in a complete loss of confidence, which could mean the end of the US dollar.
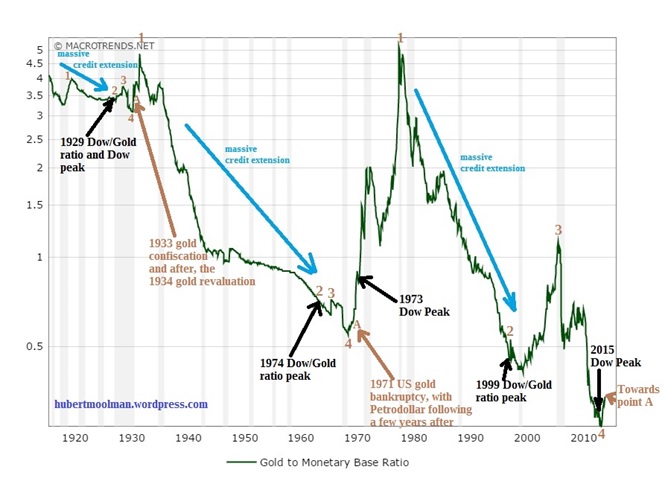
Below is a chart that shows the ratio of the gold price to the St. Louis Adjusted Monetary Base back to 1918. That is the gold price in US dollars divided by the St. Louis Adjusted Monetary Base in billions of US dollars. Therefore, the current ratio is 0.34 [$1 320 (current gold price)/ $3 873 (which represents 3,873 billions of US dollars)]:
The US Monetary Base basically reflects the amount of US currency issued. Originally, the monetary base is supposed to be backed by gold available at the Treasury or Federal Reserve to redeem the said currency issued by the Federal Reserve. The Federal Reserve does not promise to pay the bearer of US currency gold anymore; however, it does not mean that gold (it’s price and quantity held), relative to the monetary base has become irrelevant (read more).
This monetary base as the name suggests, is at the root of debt or money creation in this debt-based monetary system. We can judge (or measure) the system by the quality of the monetary base. The ability to pay gold (or gold backing of the monetary base) is the measure by which we will know how corrupt and leveraged the system is.
In August 2015, I estimated that the US would need to have 114,771 tons of gold to back the monetary base. By some estimates, this is about 67% to 74% of all the world’s gold (above the ground). They claim to have about 8 149 tonnes, with 22,000 tonnes being the most gold reserves the US has held at any point in time. They would never be able to obtain that much gold. Furthermore, a full gold backing of the monetary base would have gold priced at around $15 000 an ounce.
I have indicated on the chart the three patterns (fractals) by marking them 1 to 4. On all three patterns, I have indicated the points (2) where the Dow/Gold ratio peaked. These all came after a period of credit extension, which effectively put downward pressure on the gold price. Note the similarity of position of these points on the three patterns.
After the peak in the Dow/Gold ratio and point 3, the Gold/Monetary Base chart made a bottom at point 4 on each pattern. It is at these points that the monetary base could not expand relatively faster than the gold price increased. These points were the all-time low level of the ratio at the relevant time (the key stress-point mentioned above). This point (point 4 on the current pattern), in my opinion, is where control of the system was lost.
In 1933, after point 4 was in, the gold confiscation order was passed (point A). This came about, due to the pressure to fulfill gold obligations. If gold obligations had not been fulfilled, it could have led to a complete loss of confidence. Furthermore, to alleviate pressure, gold was revalued from $20 to $35. Ultimately, despite the extreme distress, the system continued.
In 1971, after the relevant point 4, due to being unable to cover all the foreign holdings of US dollars with the related amount of gold, the US suspended (really ended) the convertibility of the US dollar into gold (on 13 August 1971 at point A). Although this was, in reality, a default which should have led to a complete loss of confidence in the US dollar, it did not (in part due to the Petrodollar standard).
It now appears that point 4 is officially in, on the current pattern. We could at any time reach a point A at which a major event in the gold & silver or/and bond market could happen. Any rise in the Gold/Monetary Base ratio is a step closer to that event. This will be that loss of confidence in the US dollar and US bonds. Although a few things might be attempted to prevent a complete lack of confidence (for example, an official US dollar devaluation), it will ultimately fail, due to the extent of this crisis, as well as other critical economic issues.
One of the most important issues is the fact that the Dow is near all-time highs and is about to crash. This is the first time that point 4 on the Gold/Monetary Base chart will basically coincide with a Dow top/crash. See below:

The top chart is the Gold/Monetary Base chart and the bottom one is the Dow (both from macrotrends.net). The 1930s crisis-point came after the Dow top/crash. The 1971 crisis-point came before the Dow top/crash. The current crisis point came virtually at the Dow top, just before the coming crash. This is the worst possible timing, for the survival of the existing monetary system.
This can be compared to fighting a lion with bear hands. If you manage to beat it, the system can continue. In the 30s, you are tied to a pole (Dow crash) before the fight, but freed just before the start of the fight. In 1971, you are tied to a pole after the fight. Today, you are tied to a pole during the fight, which gives you an additional handicap.
The monetary system could collapse at any time from this point. This warning should not be ignored.
For more of this kind of fractal analysis, you are welcome to subscribe to my premium service. I have also recently completed a Silver Fractal Analysis Report as well as a Gold Fractal Analysis Report.
***********
Also Read:
Gold Prices: The Road to $10,000
Gold & Silver Prices To Rise As Global Financial Reset Could Be Soon


