Gold And Silver – It Is Always About One Thing: TIMING


Is the current rally from the lows the result of:
A. Long lines to buy silver and gold coins world-wide
B. Unprecedented demand for those same coins, year over year
C. Drawdowns of physical gold/silver on COMEX
D. Central bank PM vaults about empty
E. Reneging on delivery by banks to gold customers
F. Deutsche Bank demanding repatriation of some of their gold, [unavailable]
G. Allocated gold accounts that have no allocated gold, [Paper promises instead]
H. China, Russia, India taking all offers by the tonne
I. Potential attack on Syria unilaterally by O[bomb]a
J. All of the above
K. None of the above
We would take “J. All of the above”, and then add, is that all there is? Is that the best the gold and silver market can do in light of so many ultra-positive dynamic developments? Is there any powder left in the PM guru muskets to substantiate pie-in-the-sky-promises, all unfulfilled, as of Friday? How much more information will it take to propel gold up to the “lofty” 1438 level? [Not as much pie, and not as much sky.]
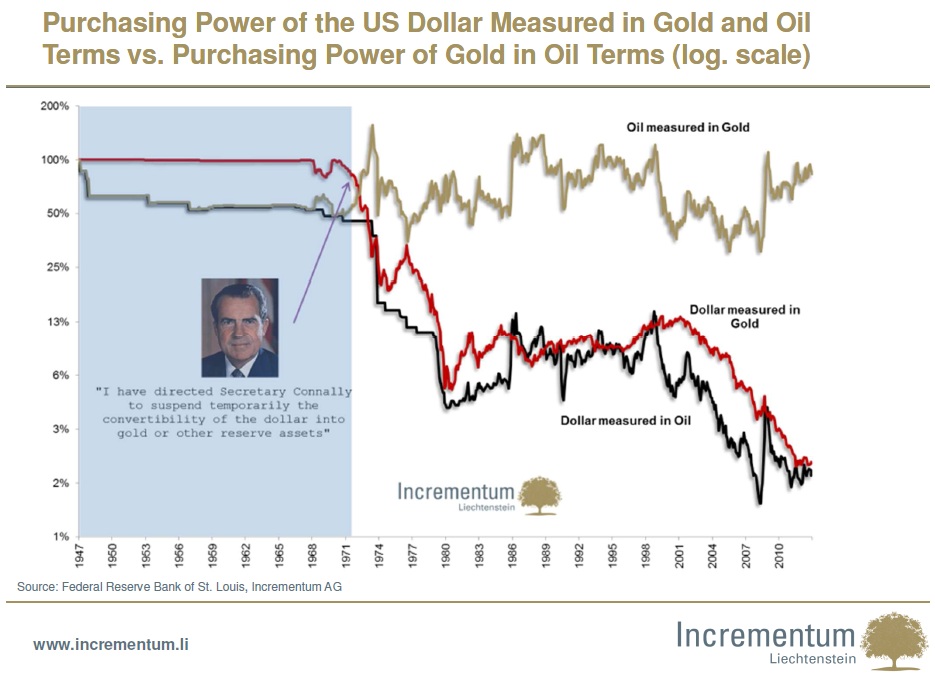
There is one exceptional chart that best captures the essence of the current PMs scenario within its 5,000 or whatever year history, and it lets all know that everything else is a symptomatic consequence. When you understand the implications of this chart, you then understand it is all a matter of timing. You can add to the above list as many other aspects relating to gold and silver, and when the list is complete, ask, “How is it working out for you?”
Credit to Incrementum for their great chart. It would be even more dramatic had it gone back to 1913, when the private banking cartel, aka Federal Reserve, took control of the US money supply. It has always been just a matter of time. Everything else is but a symptom.
The London fix has been replaced by the endless “guru fix’ to supply the shot in the arm so necessary to sustain the belief of over-the-moon-prices. “So and so said gold is going to $5000 and silver to $300.” And?
How many times have we heard it? The drum beats are again getting louder. Meanwhile, the market struggles to maintain a solid rally. “The paper market is not the real market!” Okay, where is the “real market?” Being neither Russia nor China, most people are paying “paper market” prices for the real physical.
It is not that the potential for much higher prices is unlikely or the messages are without merit. It is not as though we have not been drinking the same gold/silver Kool-Aid, for we bought gold over $1700 and silver over $45, [physical], and still own it, as well as still buying. No credit here for timing, on that score, although the buying was more than for price sensitivity. It was for the pragmatic purpose of actually having the metals, in hand, no matter where the price was. That has been covered numerous times, already.
This is why we only rely on charts to do all the “talking.” The market is the chief Auditor of what the actual participants have to say. “Listen to what the market is saying about others, and not what others are saying about the market.”
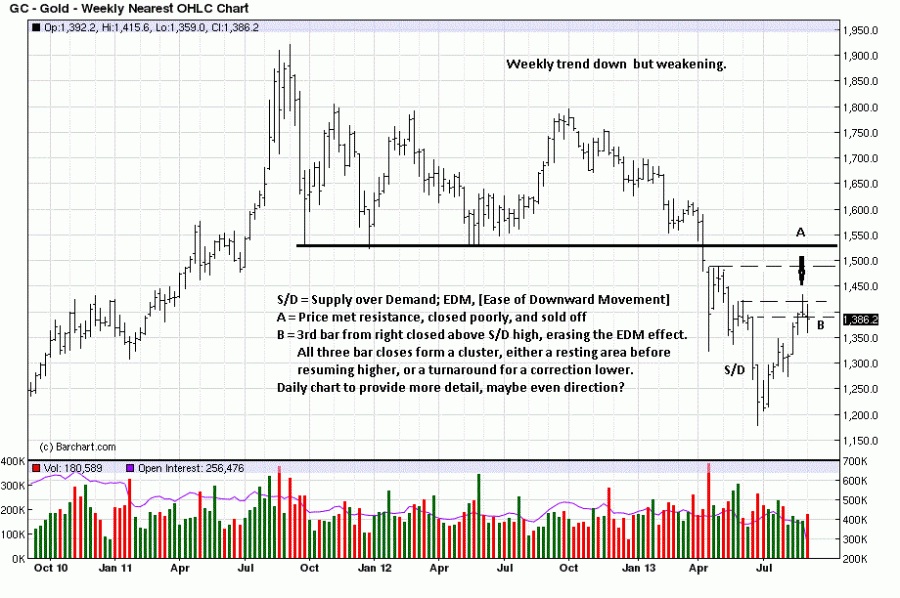
Another potential the weekly chart shows is from the late June low to the August swing high, price can easily correct to 1270 area and still keep the integrity of a potential bottoming formation intact. It is all about timing.
The chart comments adequately express what is developing near term. It is necessary that we admit to taking “stupid pills” when gold reached the August swing highs. Instead of realizing at least partial profits at an obvious resistance area, we ignored the clear message of the market and opted for “staying long” based on the “obvious” non-timing market belief that “reality” would set in. That was a misplaced “belief.”
It is all about timing. Why didn’t we read our own message?!
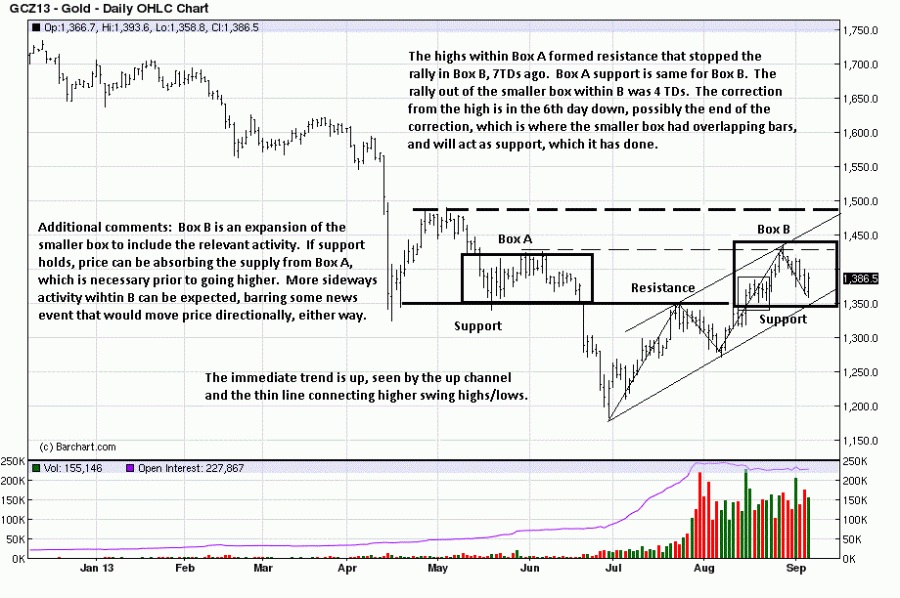
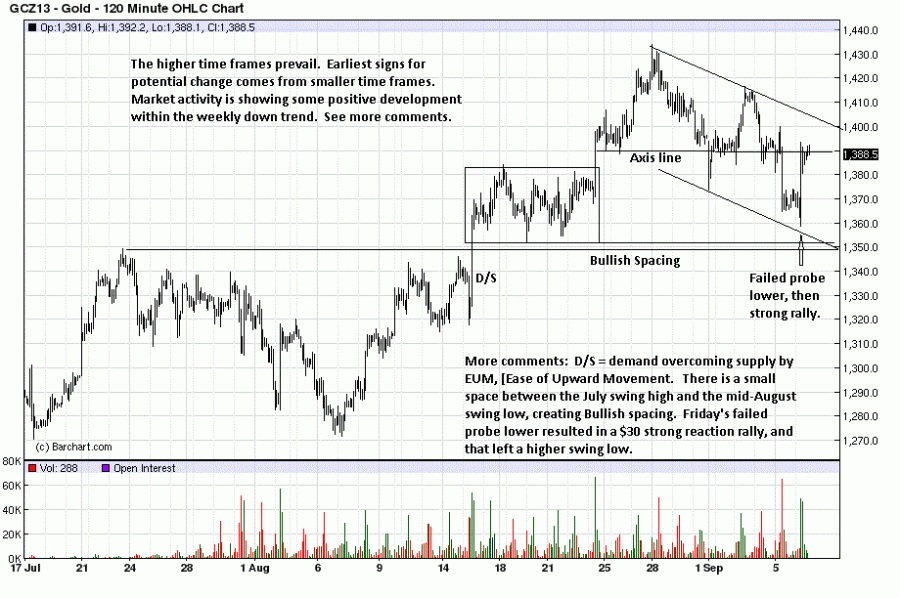
There are some positive short-term developments noted on the chart, but this lower time frame is subservient to the higher time frames. It does not look like a correction could go to the 1275 area, on this chart, but the weekly says it could happen, and we all need to be aware of the possibility. Let the market lead the way, then follow.
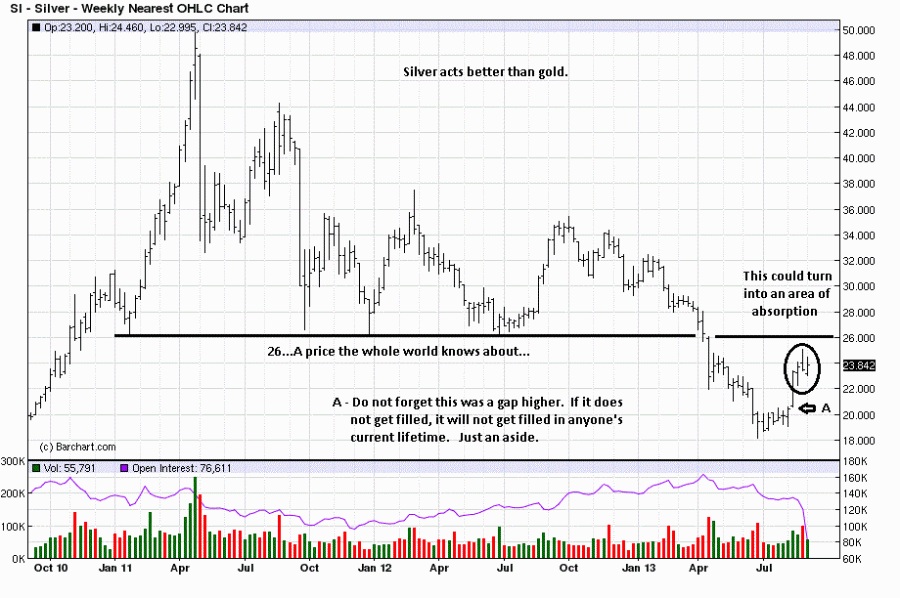
Silver continues to hold better than gold, for whatever reason. The gap we noted, when it occurred, is interesting to follow, just for drill, to see if it holds, [for a lifetime] or gets filled.
The whole world knows about that 26 resistance area, so expect some backing and filling when it is next approached.
The current activity on the right side is necessary to absorb all the selling from the left side box area. Since no one knows how any market will develop, we do not know how much time it will take for silver to spend whatever time is needed to successfully rally above the 25 area, which may also be a part of the more obvious 26 price level.
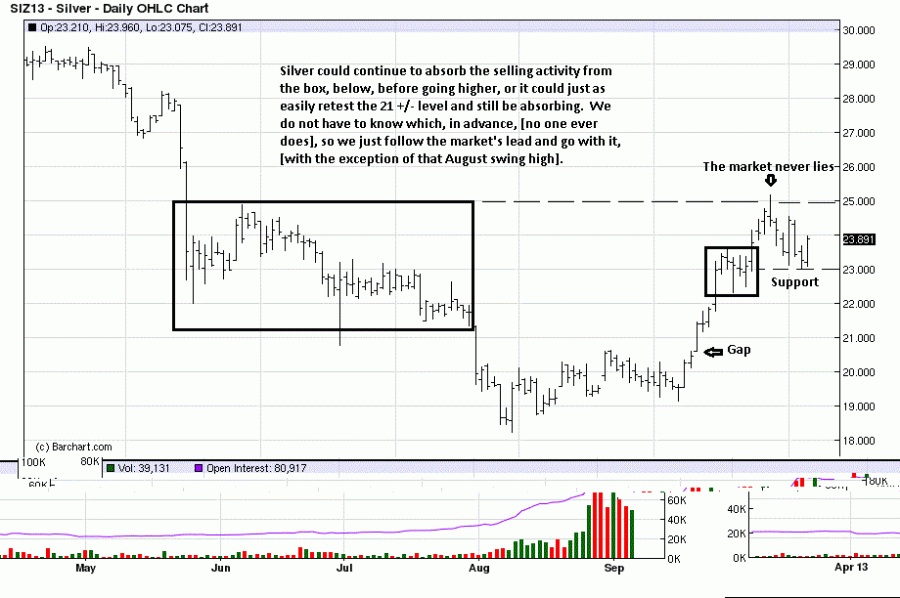
The intra-day breakouts, D/S notations, are growing more than selling efforts, S/D. When, and how price approaches/overcomes/fails to overcome the immediate 24.60 area will provide important market feedback on the character of the silver rally.
Still long both metals.
********
Edge Trader Plus


