
Gold And Silver – Only Votes Cast In Elections Count, Same For Markets
 share
share
 share
share
 share
share
 share
share
 share
share
In an election, it does not matter if voter turnout is high or low, the outcome is determined by the actual votes cast. The same holds true for the markets. Only those who make an actual buy or sell decision determine the outcome of the market trend. The market “voters” turn up in charts, recorded in the price range, close, and volume. Collectively, a “story” unfolds, and it happens to be the most accurate one for outside opinions do not matter. Articles written about fundamentals, pundit declarations, etc, all fall under the category of opinions.
While it is [usually] certain that fundamentals ultimately drive all markets, there is a lag or lead time that does not always coincide with current market behavior. For the gold and silver markets, fundamentals as exist in great demand, currently do not apply. The faux [supply] paper market, which cannot even justify its existence anymore, has been the driving force.
What makes a proper read of price and volume, over time, in the markets so cogent is that they reflect reality. They are factual records of actual transactions from those who have chosen to translate their beliefs/opinions, etc, into a firm decision that reflects market intent.
It defies common sense, given the known factors about the demand for PMs, the paucity of supply, banks reneging on delivering physical, central bank stocks dropping like a gold bar, and more, which is why reading charts has been more accurate as a barometer for the past few years. It is what is not known, both widely and by the public that has succeeded in keeping price suppressed.
It speaks to the dominance of the NWO and their financial arms of all central banks that they have been able to keep a lid on any ability of a sustained rally of significance for so many Quarters. We will never actually know how they wield their power, always a highly kept secret, but at some point, the charts will show a tipping point has been reached. [This was somewhat covered in Contrary To Popular Belief, Paper Is The Bellwether For Near-Term Precious Metals, click on https://www.gold-eagle.com/article/gold-and-silver-%E2%80%93-newton%E2%80%99s-third-law-about-ready-overreact-be-prepared, first half of Commentary]
With that, we turn to a read of the market’s intent, as told by those who have actually “voted.” A note for the chart-challenged. While price activity is discussed in detail, it s presented in a logical manner that does not require a charting background. Follow the explanations and this technical “stuff” makes sense. It is the texture of developing market activity and understanding it.
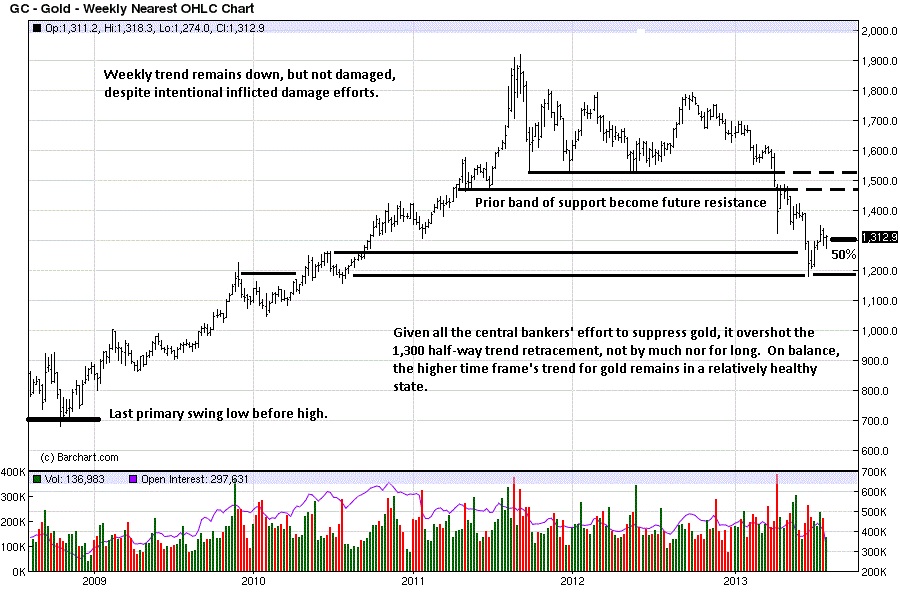
W D Gann was famous for relating past market behavior, both in time and price, to then current price activity. The power of a previous resting point, just prior to a major rally, cannot be underestimated. There is an example of this in the weekly gold chart.
There are two factors concurrent that alerts one to the possibility of a stopping point in the current decline. The first is the fact that 700 was the last swing low of significance prior to the almost uncorrected rally to 1900. The difference, 1200, divided in half is 600. Add that to the 700 swing low and a half-way retracement between the two major swing points is 1300.
A half-way retracement is a general measure of the strength of a market’s trend. In an up trend, price most often holds at least a half-way correction, often higher the stronger the trend. If price goes through the 50% point, but not that much or for very long, then it counts as “close enough,” as in playing horseshoes. Almost everyone knows of or about the likely manipulation of the precious metals markets, so for price to exceed the half-way mark, as gold has, is not a surprise because natural supply/demand forces have been purposefully distorted. There are comments to that effect on the chart.
The other, perhaps more pertinent issue is where price has stopped, at least for now. To the left, you see a high late in 2009, a decline, a higher rally into mid-2010, then a smaller retest that held around the swing high of 2009. The current developing market activity of the past few months has been resonating around the price area. [This concept was more loosely covered on a monthly gold chart, Newton's Third Law Is About To [Over]React. Be Prepared, click on http://bit.ly/1bXsEJE, first chart.]
Most often there are no coincidences in the markets. Price behavior at some level happens for a reason, and when a discovery of past-related-to-present can be found, it leads to a market edge. Having an edge in any market reduces risk exposure and increases profitable outcome potential. That there has been a sideways move in price over several weeks, 1. at a previous support/resistance area, and 2. at a half-way retracement area may be offering an edge.
More detail shows on the daily chart. The thin line connecting the last swing low-to-high-to-low, at the bottom of the chart is giving some first-hand factual information about how the market participants, those who have “voted” with a buy or sell commitment, are viewing the current price level of gold.
We covered the previous absorption development of mid-July, prior to the 22 July strong, upside breakout, [When Precious Metals Bottom Is Irrelevant To Your Financial Health, http://bit.ly/12Uz4Q6, 2nd chart]. You can see, since that surprise rally, price has been declining in a labored fashion. This, too, is a message from the market. Where are the sellers? Why has it been a struggle to get price lower when it fell in waterfall fashion on so many previous occasions?
What makes the above yet more interesting is the fact that the labored retracement low stopped just above a 50% retracement. A correction of a rally that holds above a half-way point is usually measured only in up trending markets. This is one in decline. Why would price show relative strength in a weak environment?
Look at the string of consecutive red volume bars indicating price closed below the day before. All that volume, [effort by sellers], did not yield any results. In fact, the last bar of that 11 day decline was a small range that closed on the high and above the previous day. It tells us buyers were taking control away from sellers. A rally did ensue. That beings us to Friday’s bar.
The range for Friday was small, the smallest in many trading days, and it occurred at the high of this rally. A small bar at the high of a rally reflects a lack of demand. Buyers were unable to push price higher, perhaps spent from previous effort. It opens the door for sellers to step in and push price lower. So far, for as weak as demand was, sellers were a no-show.
We had recommended the long side since the 22 July rally, and stepped aside because of that bar, viewed as a red flag. This is not a market trending up that allows for the benefit of the doubt for buyers. Caution seems warranted until proven otherwise.
1350 is the first important area of resistance. How price approaches and reacts to that level will give more market insight into the developing potential strength of gold, or not. If price reacts poorly, expect more sideways, possibly lower market activity.

What was explained on the gold weekly chart applies equally to silver. Of late, silver has shown better relative strength over gold. The level of where support shows in silver is stronger than gold, but the overall chart pattern for gold is stronger than that of silver.
New lows remain a possibility, but the probability of that event grows smaller. As noted on the chart, this is silver’s best close in 8 weeks, telling us buyers successively absorbed sellers over that time span.
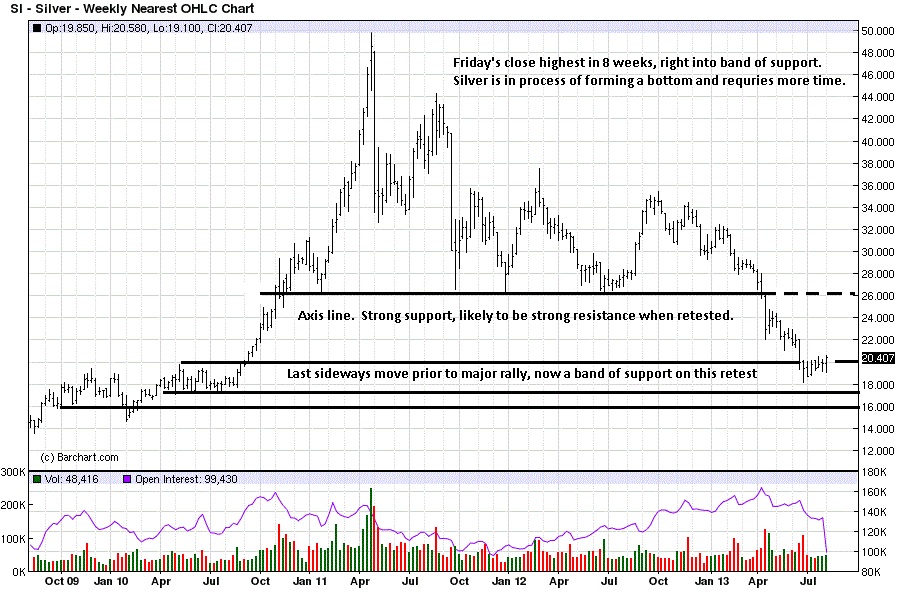
You can see how silver has held better, relative to gold. Where gold more that retraced the low of the 22 July rally, at no time was there a close under silver’s low from that same date. Note also the strongest volume bars are green, indicating a close above the previous day. It should be the opposite in a weak market.
If this has been absorption, there is enough built-up buying to take silver above 22. It may not be easy or in just a day or two, but price can rally and go on to challenge the next higher, and stronger resistance at 26.
Silver, like gold, is not out of the down trend, but there are some positive signs of change developing. We recommended long silver, for the first time in some time, at 19.42, and sold half the position at 22.16, on a rally, to lock in a profit and see how the other half-position fares.
Our opinion of both gold and silver has been strongly biased to the long side, qualified for the physical metals, throughout the move for over a few years. The reason for the buy call was based on factual developing market activity, based on observing how the market participants, the voters, were behaving. We saw an edge and jumped on it.
For clarity, we followed developing market activity’s lead and did not get ahead of it. After all, the market is the best source for information, and that is a fact.

- See more at: http://edgetraderplus.com/market-commentaries/gold-and-silver-only-votes...
share
share
share
share
share


