Gold And Silver – Those Heeding Market Activity Are Being Rewarded


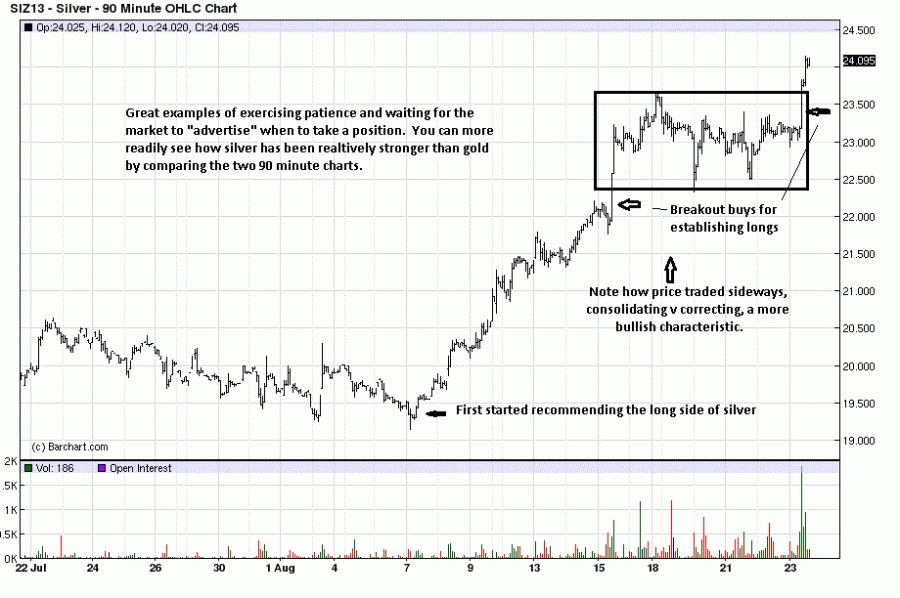
Last week was an homage commentary to the market forces, what we always attribute as being the most reliable source of information. For the first time in many months, we began recommending the long side in futures, starting on 7 August: 19.42 for silver and 1308 for gold. We have been in and out a few times but continue to remain long, adding on Friday’s strong rally.
The “news” has not changed all that much, with many PM proponents still promising the substantially higher prices. More articles are beginning to assert “Gold/Silver is ready for a substantial move higher,” type-of-hype. Of course, these are the same people who have been singing the same tune for well over a year. The sin in lack of timing gets glossed over in the [old]“new” drumbeat.
It can be asserted here, on record, that we have shunned the long side of paper futures for quite some time over the past few years. There were a few buy attempts near the lows of the 18 month trading range, but nothing of any duration, simply because the market was not primed for long positions. That appears to have changed, not because we say so, but because the market is making the statement in the form of price behavior.
The early probes to the long side, since 7 August, were always cautious with an eye out for getting hammered, as in some of the unwarranted take-downs in April and June. There was an initial lack of confidence, based on what the market had done, but the developing activity of the past few weeks has altered that view and puts it more in line with all of the ardent beliefs in the “not-allowed-to-show” Demand side of the equation.
This was addressed almost a month ago in “Newton’s Third Law Is About Ready To [Over] React. Be Prepared, [click on https://www.gold-eagle.com/article/gold-and-silver-%E2%80%93-newton%E2%80%99s-third-law-about-ready-overreact-be-prepared if you missed it.] The widely recognized artificial paper market manipulation, by the criminal central banks and Wall Street enterprises, [if you, or anyone else you know acted in the same way, you would be in jail, branded as a financial "terrorist," the new noun used by government to curtail all Rights and suppress free speech].
The Truth, that which almost all of us seek, is always to be found in reading the charts. They may be difficult to read, at times, but those times are also a message, perhaps just to stand aside. One does not have to be technically astute to understand the logic of developing market activity as it unfolds in a chart. Common sense is all one needs to follow what is presented in them.
Friday was another good day for gold and silver. It was similar, but not nearly as time sensitive, to last week’s “Buy Right Here Right Now,” scenario that began a very strong rally, [Fundamentals Never Say When. Charts Do And It Pays To Listen, 3rd and 6th charts, https://www.gold-eagle.com/article/gold-%E2%80%93-fundamentals-never-say-%E2%80%9Cwhen%E2%80%9D-charts-do-and-it-pays-%E2%80%9Clisten%E2%80%9D ]. The 6th chart is an intra-day on silver, and it shows the entry/exit levels since we started recommending the long side.
The area identified as potential support came from our 10 August chart, using information that the market provided to make a logical conclusion. [Only Votes Cast In Elections Count. Same For Markets, [ https://www.gold-eagle.com/article/gold-and-silver-%E2%80%93-only-votes-cast-elections-count-same-markets , 1st chart for gold, 3rd chart for silver, below]. The weekly is more helpful for context, where the daily and intra day are used more for timing.
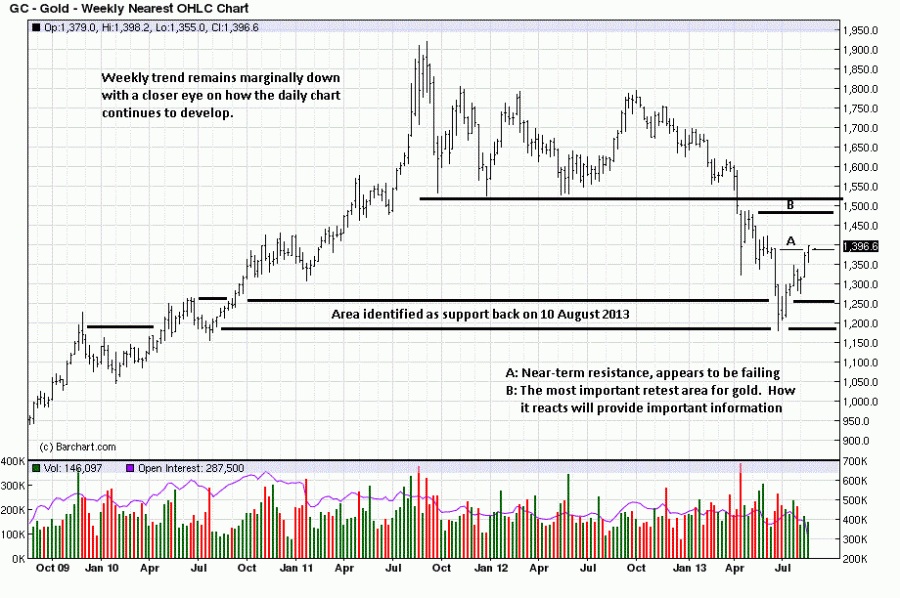
The overlapping bars, since the last strong breakout, tell us that buyers and sellers are in balance. From balance comes unbalance and a trading opportunity. The market has given a few clues as to which way the unbalance direction would unfold. Firstly, there was a strong upside bar that preceded the small 5 day trading range, TR. Another clue comes in recognizing how little price retraced the gains from the rally 7 bars ago. It shows a weak reaction, and we know that weak reactions almost always lead to higher prices.
The market has put everyone on alert to be prepared to act. All that is needed is a reason. What would that reason be? If you see a wide range rally bar on increased volume that goes above the TR, it is a buy, as was demonstrated on the previous strong rally bar.
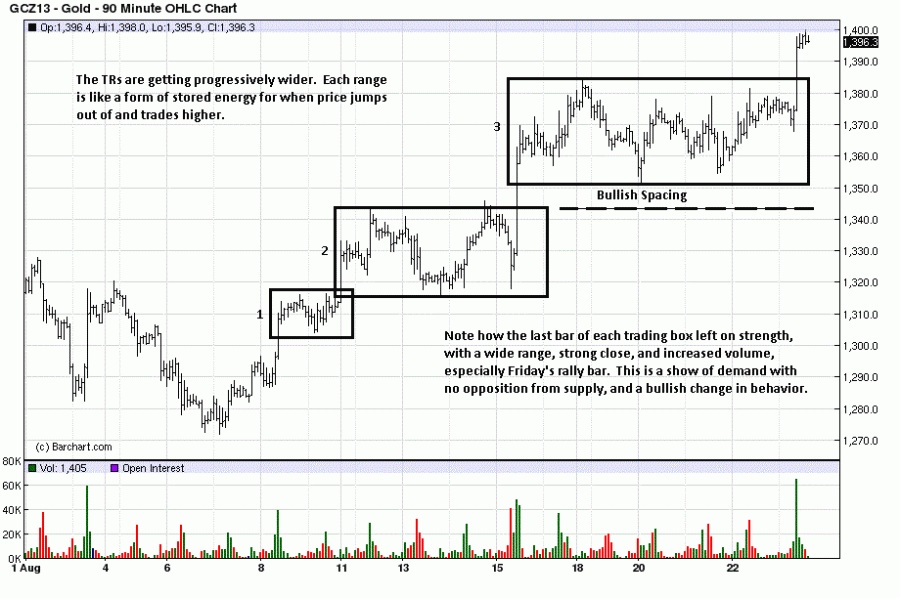
Here is another market axiom. Price patterns repeat, over and over and over. All one has to do is be able to recognize them and be ready to act. Not all patterns will lead to the same results; some can even result in a loss, but if you act on a series of 10 such trading opportunities, you are virtually guaranteed a profitable outcome. The “guarantee” is based on the Law of Probabilities. It works.

Three of the most recent TRs have been identified below. What a coincidence. We just mentioned how patterns repeat, and here are three examples. The market gives us yet more important information about this last TR breakout. Underneath is what is called Bullish Spacing, where the current swing low is ABOVE the last swing high. It tells us buyers are not waiting to see if/how the last swing high will be retested. There is now a greater sense of urgency. We are “reading” the footprints of all market participants.
That is an edge. Having an edge leads to greater profit potential.
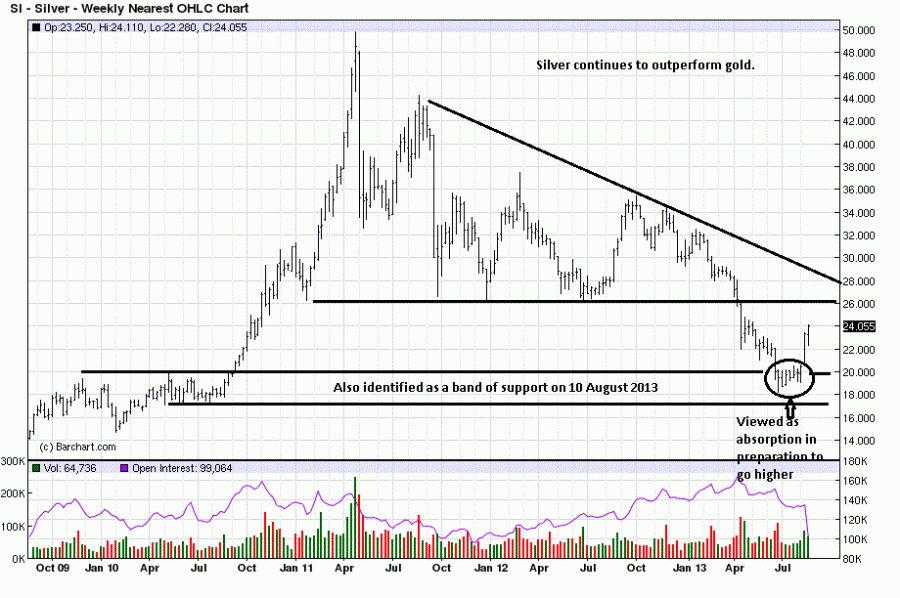
Here we see the same band of support, identified a few weeks ago, has proven to be helpful in putting market behavior into a context, and that context led us to see greater profit potential from the long side in quite a long time, over a few years.
In previous charts, we discussed how the sideways price movement was likely absorption, and if it were, price would rally, which it has. If you knew nothing about silver’s situation, or gold’s, you would still come to the same conclusion about how to approach the market. That, too, is an advantage, and it is equally available to everyone at the same time as/when price develops.
Last week, we said the single most important observation on the weekly chart was the gap up range for the week. It was wide, a strong close, and on increased volume. Sometimes, markets are that simple.
Bullish spacing is very apparent on this chart. This observation is equivalent to last week’s weekly gap to the upside. As was pointed out earlier in gold, the inability for price to go lower and stay low, during the week, was amplifying a likely upside breakout based on the market’s advertising the bullish spacing. Again, using the logic of developing price activity can sometimes lead to a very obvious, or at least probable. outcome.
Keep in mind, as we talk about futures, this bodes equally as well for those operating only in buying and holding physical gold and silver. The additions in both physical gold/silver from just last Thursday are looking great, not that is has to for the reasons for buying are vastly different. The buy from two weeks ago looks even better. Consistency is important.
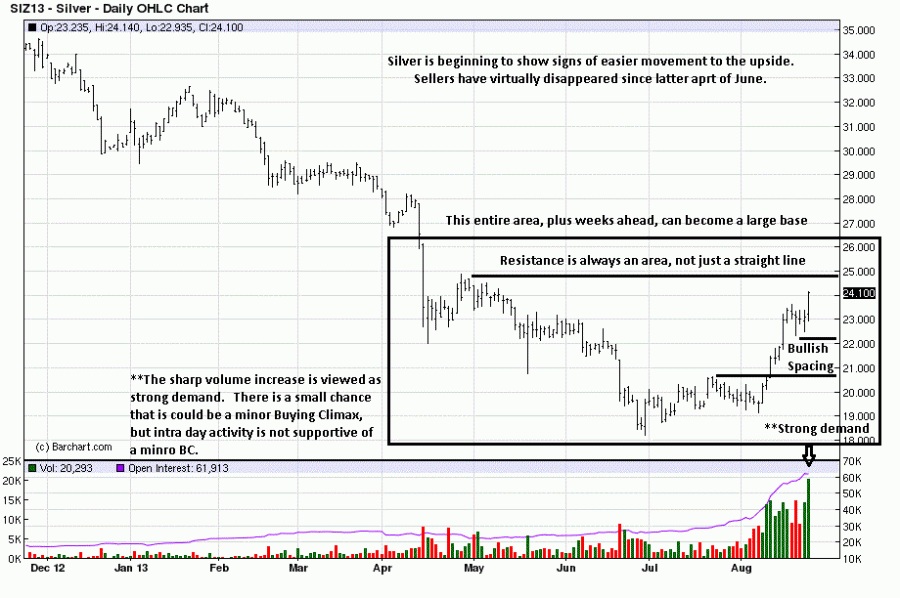
A correction usually entails at least a third retracement from the last low to current high. It is not a hard and fast rule, but mentioned to contrast it with price consolidation, when a retracement is shallow, as you can see clearly how activity within the box hardly retested anywhere lower. Once again, the market is signaling its intent, based upon the entirety of all market participants.
Anyone who thinks markets are random simply is ignorant in reading developing market activity. We will say it again: market patterns repeat, over and over, and by observing them in development, it provides an edge in knowing not only on which side to position, but also when.
It’s a win-win.
********
Edge Trader Plus


