Gold and Silver Bottom
 share
share
 share
share
 share
share
 share
share
 share
share
There may be no better time to take stock of Gold and Silver technicals after a weekly, monthly, and quarterly close on the same day.
Precious Metals have been correcting for nearly two months and have struggled as capital has flowed out of bonds and into equities. That means a tighter Fed and no decline in real interest rates.
But how much tighter can the Fed be, given the economic and financial risks?
Moreover, how can they stop hiking soon if the inflation rate (excluding commodity prices) has not declined materially?
The recent price action in Gold and Silver suggests the aforementioned correction has ended.
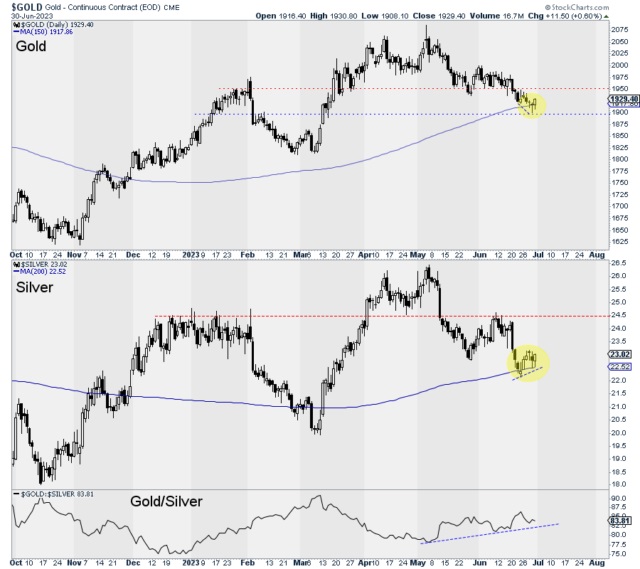
Gold formed back-to-back bullish hammers on Wednesday and Thursday, testing $1900 before closing the week at $1930. The bears had a chance to push Gold below $1900 at the end of the month and quarter but failed.
Gold also rebounded from the 150-day moving average, which is a frequent support area based on my study of Gold’s price action in the early phases of new bull markets.
Furthermore, Silver formed a positive divergence as it bottomed before Gold and is holding above its 200-day moving average. Silver faces initial resistance around $24.50.
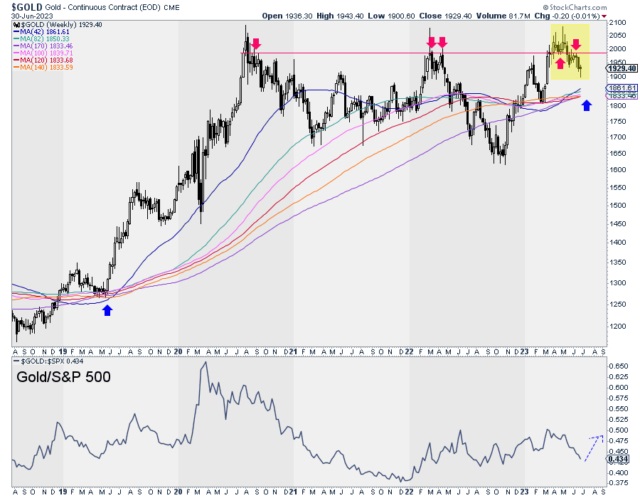
The short-term trend in Gold has turned higher, but Gold will hit significant resistance at $1985 to $2000. The weekly (below) and monthly chart show distribution around that resistance.
Gold needs to perform better against the stock market to break above resistance. Also, we cannot rule out a test of very strong moving average support in the mid $1800s.
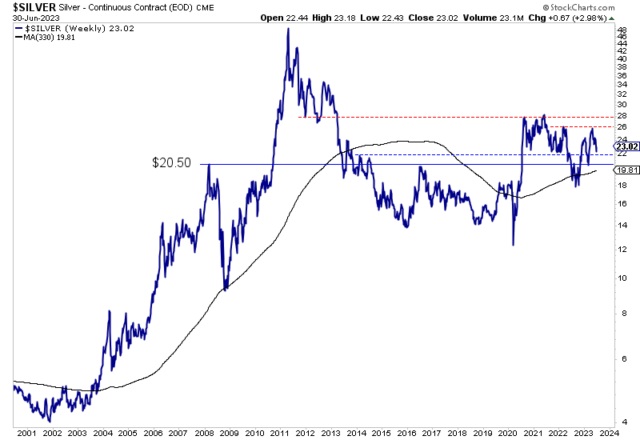
Silver will face initial resistance at $24.50, but on the weekly chart, $26 is the next significant resistance. Support is at $22.
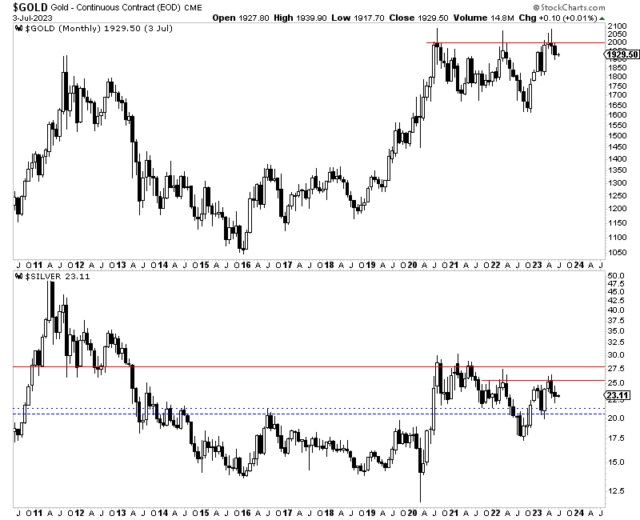
The resistance levels on the monthly chart are quite clear. Those are $2000 for Gold and $25 and $28 for Silver.
Gold has tested and failed to close above $2000 in each of the last four months. Silver has tested and failed five months (in the previous 17) to close above $25.
Gold and Silver and the respective mining indices (GDX, GDXJ, HUI, etc.) have formed bottoms. However, the metals are going to run into significant resistance.
Gold at $1930 is only $50-$70 from significant weekly and monthly resistance. Silver has started outperforming Gold and has more room to run before testing weekly resistance at $26.
Look for initial resistance in Silver at $24.50 and Gold at $1980 to $2000. Next would be a test of $2050 for Gold and $26 for Silver.
Last week we wrote about the importance of a steepening yield curve for Gold.
Though only days old, the current rebound will become quite significant and sustained if an inflationary steepening of the curve develops. In this scenario, long-term bond yields would rise faster than short-term yields.
I continue to focus on finding high-quality gold and silver juniors with 500% upside potential over the next few years. To learn the stocks we own and intend to buy, with at least 5x upside potential in the coming bull market, consider learning about our premium service.
*********
share
share
share
share
share

Jordan Roy-Byrne, CMT is a Chartered Market Technician and member of the Market Technicians Association. He is the publisher and editor of TheDailyGold Premium, a publication which emphasizes market timing and stock selection, as well as TheDailyGold Global, an add-on service for subscribers which covers global capital markets. He is also the author of the 2015 book, The Coming Renewal of Gold’s Secular Bull Market which is available for free. TheDailyGold.com was recently named one of the top 50 Investment Blogs by DailyReckoning and WalletHub.


