Gold And Silver Chart Comparisons


 With both gold and silver putting in big moves higher the past week, I thought it would be timely to investigate both charts and see if anything can be gleaned from them. I have used the weekly charts of both commodities to do this. Let’s begin with the gold chart.
GOLD WEEKLY CHART

We can see gold has surged in the last week. I have drawn a downtrending line across the two previous tops. I originally thought this is where price would find resistance and turn back down. It still may. However, I’ve seen this trend line on a lot of charts recently so it is starting to appear too obvious. So I started to think about alternatives. I have drawn a horizontal line which I’ve labelled Minor resistance. This level stems from the March 2014 high at US$1389. I suspect price can push up to there before turning back down. This can be seen in the green highlighted circle.
I have also drawn a horizontal line at the lows which I’ve labelled Major support. This level stands at US$1180. Now, as I noted in my previous gold report, we can see a double bottom has formed at this level. As Gann noted, double tops and bottoms generally don’t end trends and I highly doubt this double bottom will end the downtrend in the gold price.
Now the reason I expect gold will not rise above the minor resistance level is that if it did it would be a sign of bullishness. And considering I believe there is still lower to go before the final correctional low, I struggle to see price showing too much bullishness at the moment. As outlined in my previous gold report, I am looking for the gold price to finally bottom out under the important psychological level of US$1000 which is conveniently close to the 76.4% Fibonacci retracement level of the upleg from 2008 low to 2011 high. That level stands at US$973.
Let’s now have a look at the weekly silver chart and see what comparisons we can make.
SILVER WEEKLY CHART
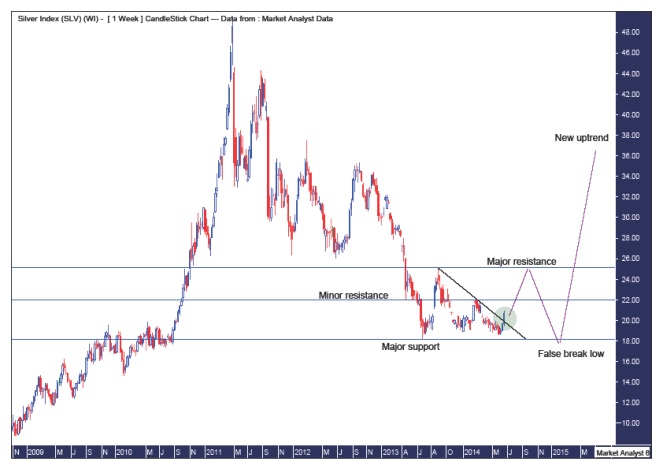
As with gold, we can see the silver price has also surged this week. So much in fact that it has taken out the down trending line I have drawn across recent tops. This breakout can be seen in the green highlighted circle. I expect to hear a lot of hooting and hollering from chartists now referring to this breakout and calling the end of the silver bear market. Hogwash is what I say. Admittedly, silver does appear to be in a more bullish position than gold which still hasn’t reached its down trending line. Therefore, I expect the silver price to bust out higher above the horizontal line I’ve labelled Minor resistance which stems from the February 2014 high at US$22.03. A break of this level will be more evidence of bullishness and should see price, unlike gold, push up to the horizontal line I’ve labelled Major resistance. This level stems from the August 2013 high at US$25.12.
We can see a triple bottom has formed in the silver price around the level I’ve labelled Major support. Now just as gold’s double bottom is unlikely to be the end of its bear trend, so too is the triple bottom in silver unlikely to be the end of its bear trend. However, silver is in a stronger technical position than gold. Even so, price should be held by the major resistance level. If and when rejected, price should come back down to major support. But unlike gold making a clean break of major support, silver’s strong technical position should prevent it from a clean break below support. I expect only a false break marginally below the June 2013 low at US$18.17.
In my previous silver report I drew Fibonacci retracement levels of the upleg from 2008 low to 2011 high. And just as I expect gold’s final low to be around the 76.4% level, so too do I expect silver’s final correctional low to be around the 76.4% level – this stands at US$18.10, just below the June 2013 low.
So there we have it folks. Silver is currently in a stronger technical position than gold. This should see silver rise higher than gold in the current run up while gold should push lower than silver in the next decline. But the bear market in both commodities is not over yet, as far as I’m concerned anyway.
********
Note – please email me if you would like to see my previous reports on both gold and silver.
Bio
I have studied charts for over 20 years and currently am a private trader. Several years ago I worked as a licensed advisor with a well known Australian stock broker. While there was an abundance of fundamental analysts there seemed to be a dearth of technical analysts, at least ones that had a reasonable idea of things. So my aim here is to provide my view of technical analysis that is both intriguing and misunderstood by many. I like to refer to it as the black magic of stock market analysis.
Please register your interest in my website coming soon. Any questions or suggestions, please contact [email protected]
© 2014 Copyright Austin Galt - All Rights Reserved
Disclaimer: The above is a matter of opinion provided for general information purposes only and is not intended as investment advice. Information and analysis above are derived from sources and utilising methods believed to be reliable, but we cannot accept responsibility for any losses you may incur as a result of this analysis. Individuals should consult with their personal financial advisors.


