Gold Awakes? Fed Brakes?


Welcome to the 400th consecutive Saturday penning of The Gold Update, double the number we'd intended to write until you cherished readers reversed our intent for "Gold 2000 or 200 missives, whichever comes first" to "second."
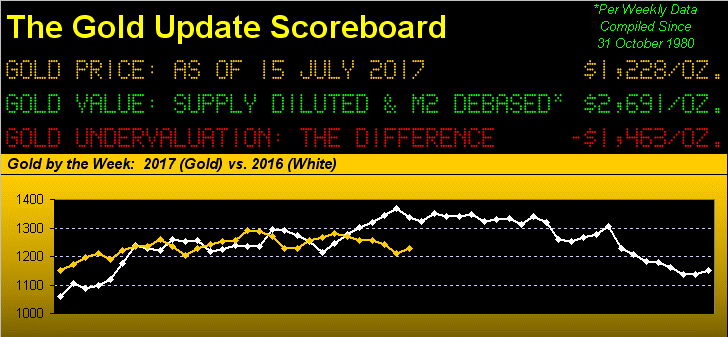
What unconscionably has yet to double -- and beyond -- is the price of Gold to the above scoreboard's level of 2691, let alone get anywhere even near the 2000 mark, the lowly highlight of the past three years being 2016's return up to Base Camp 1377. Worse, as the above price track shows, today at 1228 Gold is 110 points (-8.2%) below where 'twas at this date a year ago. One can either read it and weep, or better, Gold go and reap, for in the long haul to buy down here is ever so cheap.
'Tis especially true when Federal Reserve Bank Chair Janet Yellen, just a week ago having ruled out there being another major financial crisis "in our lifetime" ... followed up such conclusive comment on Wednesday with this 180° whirlabout of wisdom: "Let me state in the strongest possible terms: I agree ... current spending and taxation decisions ... [are] ... going to lead to an unsustainable debt situation, with rising interest rates and declining investment ... that will further harm productivity growth and living standards."
We all know the Fed is behind the curve, but they're just figuring this out now? Then add on International Monetary Fund Managing Director Christine Lagarde stating that "financial vulnerabilities present an immediate concern”, and the price of Gold today ought be as fat, dumb and happy as ever. Instead in turning to the weekly bars for Gold, we find it rather waifish, stumbling along a dark, puddled back alley, cold, frail and unwanted in having recorded a "lower low" for the fifth week in-a-row:

To be sure, Gold did net a gain 16 points for the week, settling yesterday (Friday) at 1228; but to put that into perspective as to just how gloomy 'tis all been in recent months, 'twas only the second-best net up week for the yellow metal in the past 13! And then from here come all of those annoying overhead "Oh-Nos!", most notably the 1240-1280 box to which Gold just had said "adios" in heading further south a mere week ago.
Even more broadly as we next view Gold's daily closes from its All-Time High of almost six years ago, you can see that life of late above the 300-day moving average has been but brief. Moreover, we've not forgotten that last year's low came on the first trading day, as is thus far the case this year, but never in the post-Nixon era has such ultimately occurred in back-to-back years; so even if just a statistical anomaly, this year's Day One low of 1147 (the red line at lower right) remains vulnerable:
Such dourness notwithstanding, is Gold's price finally awakening in anticipation of a Fed rate hike braking? Friday's release of the negative growth in June's Retail Sales along with a zero-growth reading for the Consumer Price Index sure got Gold fired up. The COMEX Gold futures typically average trading volume of less than 100 contracts per minute over each session's 23-hour trading period. Yet upon those economic data releases yesterday, in a single minute more than 10,000 contracts traded. But wait, there's more: of the 2,831 trading hours for Gold year-to-date, price's 12-point rise in that data release hour was supported by the fourth-strongest hourly up-volume so far in 2017. One ought think that carries significant buying weight beyond simply flicking off Shorts like flies.
'Course such news also made the stock market happy, the Great Divergence between the overly crash-ready S&P 500 and the Economic Barometer appearing as stark as can be:
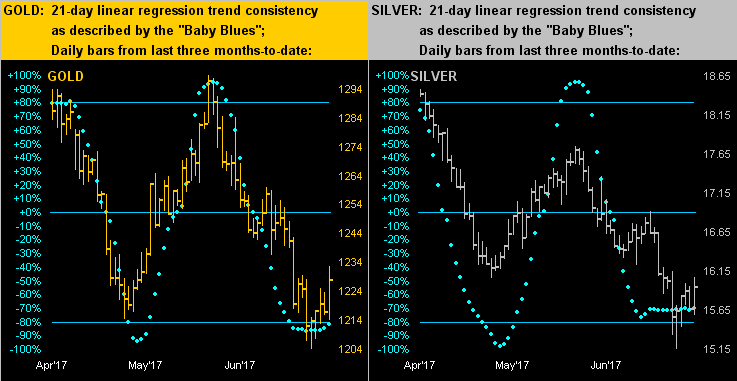
One ought well think the Fed, whilst they're never ahead, is cognizant to some degree of where the above Baro's being led. That, in turn, ought have them hit the rate hike brakes, their 26 July policy statement just eight trading days away. As for Gold's awakening, one of our favourite signals -- the "Baby Blues" -- are coming into upside play, per this end-of-day alert which popped up yesterday...
...as spawned by this next graphic. On the left we've Gold's daily bars for the last three months-to-date, the blue dots of 21-day linear regression trend consistency just now perceptively beginning to curl upward. Should the reliability of the dots' sweeping moves in recent months continue to play out, we'll see Gold make a run well back into its 1240-1280 box to that clustering area you see 'round 1250. On the right are Silver's Baby Blues which on their down run never reached below the preferred -80% line, but ought nonetheless benefit should Gold get into upside gear through here:
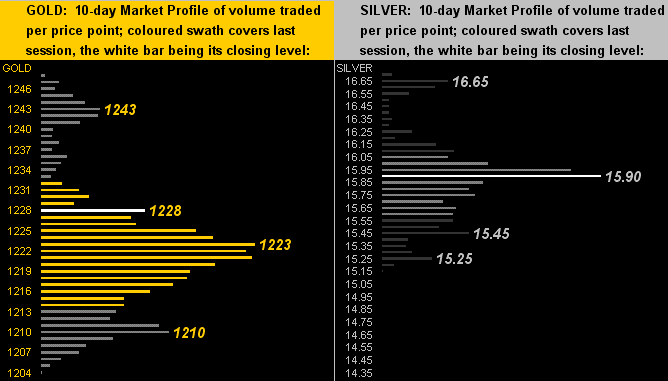
As to trading the precious metals near-term, here we've the 10-day Market Profiles for Gold (left) and Sister Silver (right), still showing that fat-fingered (or otherwise) trade trough from a week ago. Note that the yellow metal is presently ahead of its most commonly traded price of the last two weeks (1223), whilst the white metal sits right upon hers at 15.90:
This being a milestone edition of The Gold Update, indeed let's update two items from last week's missive on the unlikely chance you missed it. First we've again The Stack now as follows:
The Gold Stack
Gold's Value per Dollar Debasement, (from our opening "Scoreboard"): 2691
Gold’s All-Time High: 1923 (06 September 2011)
The Gateway to 2000: 1900+
Gold’s All-Time Closing High: 1900 (22 August 2011)
The Final Frontier: 1800-1900
The Northern Front: 1750-1800
On Maneuvers: 1579-1750
The Floor: 1466-1579
Le Sous-sol: Sub-1466
Base Camp: 1377
2017's High: 1298 (06 June)
The Weekly Parabolic Price to flip Long: 1295
Neverland: The Whiny 1290s
The 300-Day Moving Average: 1260 and falling
Trading Resistance: 1243
"The Box": 1240-1280
Gold Currently: 1228, (expected daily trading range ["EDTR"]: 13 points)
Trading Support: 1223 / 1210
10-Session “volume-weighted” average price magnet: 1222
10-Session directional range: down to 1204 (from 1248) = -44 points or -4%
2017's Low: 1147 (03 January)
Second we've again our millennium-to-date "most important Gold graphic" tracking the StateSide money supply as measured by M2 along with the price of Gold. As pointedly discussed last week, Gold has ceased its logically regressing to the track of M2, such that the next time they meet -- which is way overdue -- price will be well above and beyond "The Big Two":
Our sincere and sizable thanks to all of you highly-valued readers, linkers, publishers and broadcasters who've stayed this nearly eight-year course with us. Gold will win the battle for 2000 and we'll be here with you when it happens!

Mark Mead Baillie has had an extensive business career beginning in banking and financial services for two years with Banque Nationale de Paris to corporate research for three years at Barclays Bank and then for six years as an analyst and corporate lender with Société Générale.
For the last 22 years he has expanded his financial expertise by creating his own financial services company, de Meadville International, which comprehensively follows his BEGOS complex of markets (Bond/Euro/Gold/Oil/S&P) and the trading of the futures therein. He is recognized within the financial community of demonstrating creative technical skills that surpass industry standards toward making highly informed market assessments and his work is featured in Merrill Lynch Wealth Management client presentations. He has adapted such skills into becoming the popular author each week of the prolific “The Gold Update” and is known in the financial website community as “mmb” and “deMeadville”.
Mr. Baillie holds a BS in Business from the University of Southern California and an MBA in Finance from Golden Gate University.


