
Gold Bull Market Entering New Phase
 share
share
 share
share
 share
share
 share
share
 share
share
Gold and silver prices have both seen impressive jumps this year, with gold coming within cents of an all-time high, and silver also flirting with price levels last seen a decade ago.
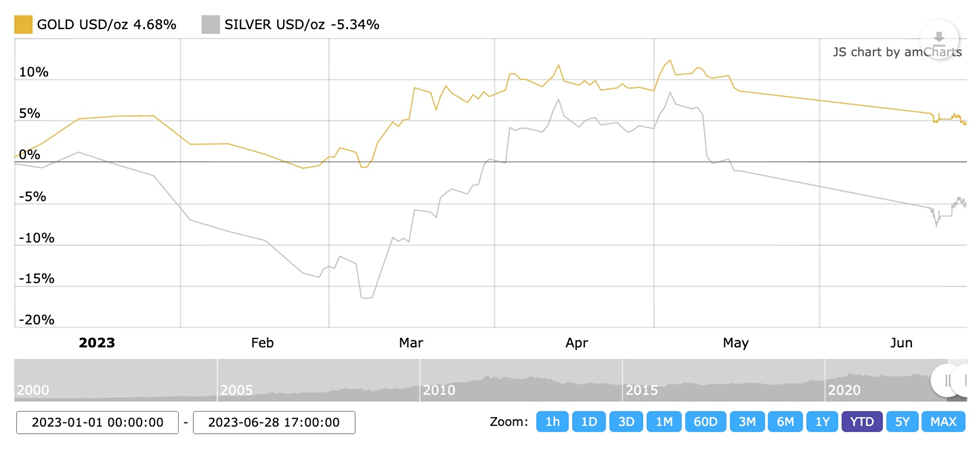
Gold and silver spot prices year to date. Source: Kitco
But the precious metals rally, according to some, has only just begun. One analyst believes it’s only a matter of time before gold surpasses double digits on its way to $12,000-15,000 an ounce.
In a recent interview, Adam Rozencwajg of Goehring & Rozencwajg (G&R), the Wall Street commodities investment firm, said “We think that gold has entered into a new phase of this bull market.”
Rozencwajg bases this statement on the firm’s first-quarter report, which found that two factors in 2020 prompted G&R to take a step back from gold: 1/ that the gold-oil ratio was favoring energy, and 2/ that silver had “caught up” to gold.
G&R now believes it’s time to step back in, mostly due to demand for gold being driven by central bank bullion purchases, which hit records in 2022 and the first quarter of 2023, but also the result of factors such as implied gold backing, referring to how much gold the government holds versus the number of dollars in circulation. The price of gold relative to other financial assets is also important. We discuss each of these concepts in turn.
Central bank buying
Rozencwajg says the new bull market phase began in the third and fourth quarters of 2022, “and it really revolves around central banks’ behavior as much as anything else. I think it’s going to propel gold much much higher in this leg of the bull market.”
Central banks actually stopping buying gold during covid, with some deciding to sell bullion to pay for social programs necessitated by virus-related economic slowdowns and business closures.
After economic recovery in 2021-22, this behavior changed, with central banks in the aggregate buying more gold in the fourth quarter of 2022 than they had since the world went off the gold standard in 1971. Individually, some countries bought more gold during this period than at any other time. The trend has carried forward into 2023.
In the first three months of the year, central banks bought a combined 228 tonnes, the most ever seen in a first quarter, World Gold Council data revealed.
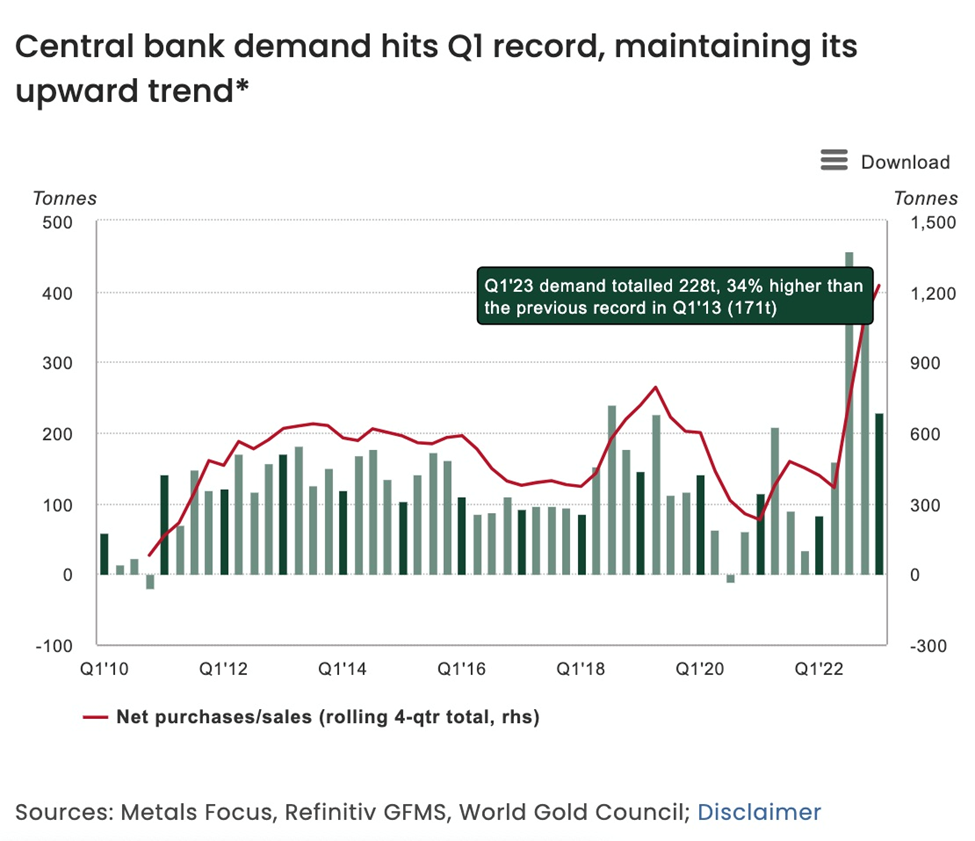
This follows up on what was already a record year in 2022, during which 1,136 tonnes of gold worth some $70 billion were added to the banks’ reserves. Compared to the 450 tonnes bought during 2021, that represents a whopping 152% year-on-year increase!
Purchases during the first quarter were reported by both emerging and developed-economy central banks, with four accounting for the majority: Singapore, China, Turkey and India.
WGC said the torrid pace of net buying in Q1 sets the tone for a higher-midpoint of the council’s full-year estimate. Despite sizable net selling in April, the organization expects central banks to remain net gold purchasers in 2023.
It’s important to understand that central bank gold purchases are largely price insensitive, meaning they do not try to time the market to buy low. “Now they’ve re-entered in a very material fashion and they’re price insensitive, so I think that’s gonna drive prices much much higher,” says Rozencwajg.
As for why central banks are buying gold, the answer almost certainly has to do with a feeling, particularly among emerging-economy banks, that the United States is going to lose its reserve-currency status, a position the US dollar has held since the end of the Second World War.
According to UBS analysts, this trend of central bank buying is likely to continue amid heightened geopolitical risks and elevated inflation. In fact, the US decision to freeze Russian foreign exchange reserves in the aftermath of the war in Ukraine may have led to a long-term impact on the behavior of central banks, the bank said.
The geopolitical tension also ties into the second reason because it weakens the US dollar, as many emerging economies look to diversify away from the USD in their reserve holdings and use gold as an alternative. Russia, as a prime example, can use gold to replace the dollar and circumvent Western trade sanctions.
Within the US, the direction of a weakening dollar is clear, with the Federal Reserve earlier this month pausing its tightening cycle after a series of interest rate hikes over the past 15 months. When the Fed cuts rates, it will weigh on both US Treasury yields and the greenback — both positives for gold.
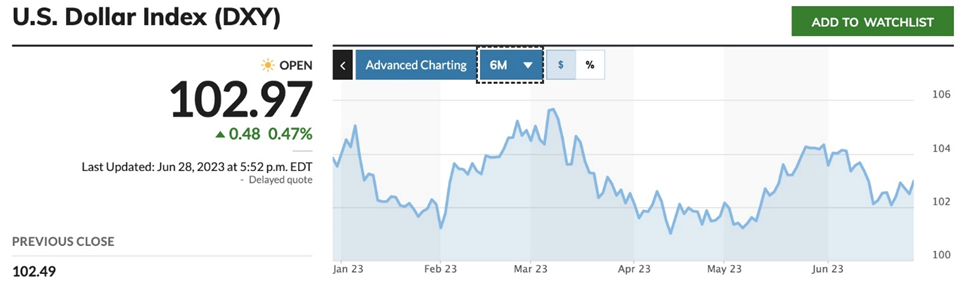
Source: MarketWatch
While there has been plenty of talk over the past few years of “de-dollarization”, the fact is there has been no evidence of countries using currencies other than the dollar for settling international trade transactions. Until now. Among recent examples, France announced it will sell LNG to China priced in renminbi, China will buy soy and iron ore from Brazil denominated in Chinese currency, and crude oil trades between Saudi Arabia and China will be settled outside the dollar.
“Any time you’re going to get a major monetary shock like that, like the end of a reserve currency system and bringing in a new system, I think that’s going to be really good for gold,” says Rozencwajg.
“Secondly if you have all these countries start trading with China there’s going to be an accumulation, an imbalance. You’re going to end up with renminbi that accumulates in Saudi Arabia or whatever the commodity-exporting country is…
“The indications are looking like you will at least use some gold to try and balance any big trade surpluses or deficits, meaning that in the case of Brazil you would sell all your soybeans to China, collect renminbi, buy as many Chinese goods as your economy could handle, and then whatever leftover renminbi you had, you could exchange at least a portion on the Shanghai Gold Exchange for gold and use that to repatriate your capital. That’s not a gold standard explicitly by any means, that is still very much a fiat paper system, however it would use gold at least on the margins to help balance trade imbalances and deficits and surpluses and to me that would be very consistent with the activity that we’re now seeing amongst the central banks accumulating huge positions in gold in their reserves.”
Gold-oil ratio
The gold-oil ratio is an important indicator of the global economy’s health.
Because gold and crude oil are both denominated in US dollars, they are strongly linked. That is because as the US dollar rises, commodities priced in USD fall, and vice versa. As the dollar drops, commodities generally go up.
Another important link between gold and oil is inflation. Because energy comprises about one-third of the Consumer Price Index (CPI), when crude oil rises it impacts inflation. Gold being a traditional inflation hedge, it follows that as higher oil prices lead to increased inflation, the gold price goes up, as more investors buy gold to diversify out of inflation-losing assets like bonds and cash.
Gold and oil are further related in that a spike in oil prices dampens economic growth, because so many industries depend on it and its derivatives as a fuel source, i.e., natural gas, gasoline and diesel (Diesel fuel is a major input for gold mining operations, therefore as fuel costs rise, so does a producer’s costs per ounce, which can lead to lower output. If this happens across the industry, lower gold supply versus demand will hike prices).
A drop in global growth, particularly in the two largest economies, the United States and China, might signal a recession is coming which is almost always bullish for gold prices.
The chart below shows the historical ratio between the gold price and West Texas Intermediate (WTI) crude. Simply put, the gold-oil ratio is how many barrels of oil can be bought with an ounce of gold.
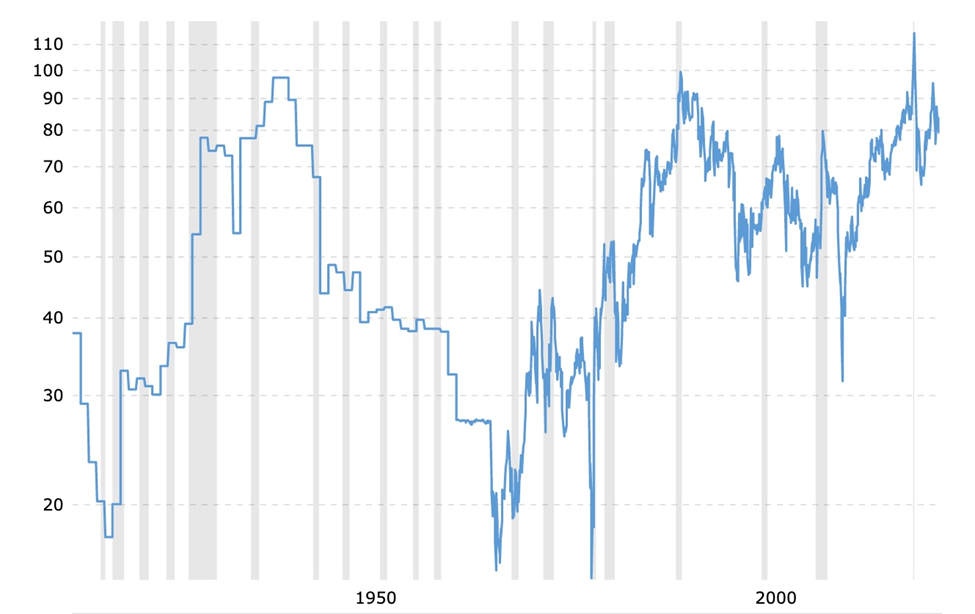
Historical gold to oil ratio. Source: Macrotrends
The next chart by Visual Capitalist indicates that gold is more expensive relative to oil when the gold-oil ratio is above 30. For most of history, the ratio has sat between 10 and 30.
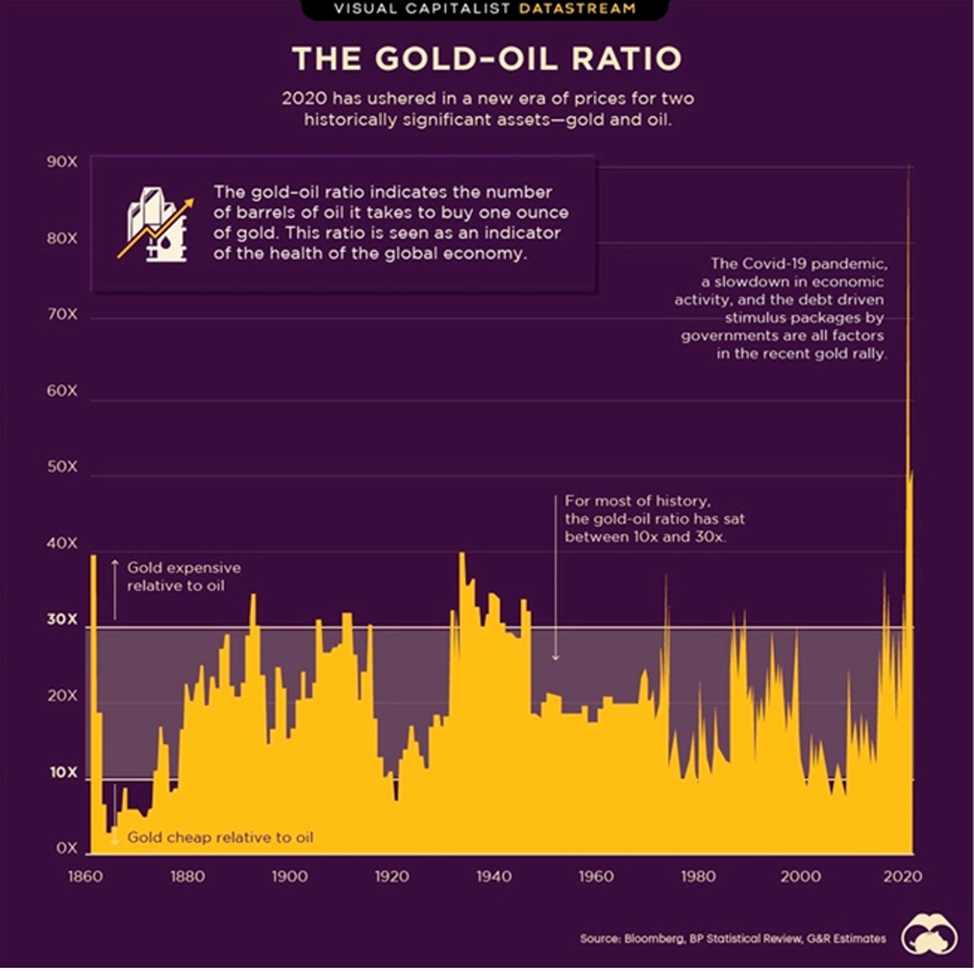
Source: Visual Capitalist
The all-time ratio high of 91 in April 2020 was a combination of plummeting WTI during the worst month of the coronavirus health crisis, which at that time was $16.80 against a gold price of roughly $1,625. Remember oil usually falls during recessions and gold rises. However the covid-19 recession was extremely short-lived. As economies recovered, growth and oil demand surged, thus lowering the ratio. When gold hit its all-time high of $2,074 in August 2020, WTI was still floundering at around $32. It took a more than doubling of WTI over the next 15 months, and gold to fall around $200, for the ratio to revert back to 25, a long way from its historic high of 91 but still higher than its average 16.
Since 2020, Rozencwaj says G&R started to see a lot of indications that the gold-oil ratio had flipped in favor of energy (it currently sits around 27). The fund therefore exited gold.
“We got those two signals at the same time,” he says. “We had this idea that silver staged this catch-up rally, which in the past has been a sign that you’re going to take a bit of a breather, and you had the fact that on a relative valuation basis, the gold-oil ratio was so favorably skewed towards energy — we’ve never had a reading like that in which oil did not massively outperform gold.”
Silver catch-up
A common wisdom is that silver outperforms gold in a strong precious metals market.
When precious metals rallied in 2020, on the back of lockdowns, interest rates slashed to zero, QE, and general market fear, silver’s gain was double that of gold. The price ran up 43% from January to December, 2020, compared to gold’s mere 20.8% rise. Earlier in the year, as gold punched above $2,000 an ounce, a 39% gain, silver rallied to nearly $30 an ounce, a 147% increase.
Yet during precious metal bulls, you often have silver lagging gold before the white metal suddenly spikes. For example in the early 1970s, gold dramatically outperformed silver for the first 24 to 30 months, before silver staged a massive rally, catching up to gold and eventually outperforming it. This is precisely what happened in 2020, setting up a cooling-off period for precious metal prices that G&R thinks is just about coming to an end.
Price target
Goehring & Rozencwajg’s price target for gold is between US$12,000 and $15,000, and while that may sound shocking to some, there are a few factors behind it.
They include the relationship between how much gold the government holds and the amount of dollars in circulation, which G&R describes as an implied gold backing. Sometimes the dollar gets backed by a lot of gold and that usually means that gold is overvalued relative to the dollar and vice versa.
Looking at the price of gold relative to other financial assets is another way of calculating a gold price forecast.
The managers of the Goehring & Rozencwajg Resources Fund say they are often asked, “Have I missed it? Is it too late to make an investment in natural resources?” Their reply is invariably, “Not only is the commodity bull market not over, it has hardly begun.”
Their conclusion is based on the fact that commodities are currently valued far below financial assets, but they will shift to being overvalued, relative to financials, sometime in the next decade, meaning there is still a lot of upside to the sector.
If history is any guide, the pendulum has to swing.
G&R presents a chart showing over the last 130 years, there have been four times when commodities became very undervalued compared to the stock market, measured by the Dow Jones Industrial Average.
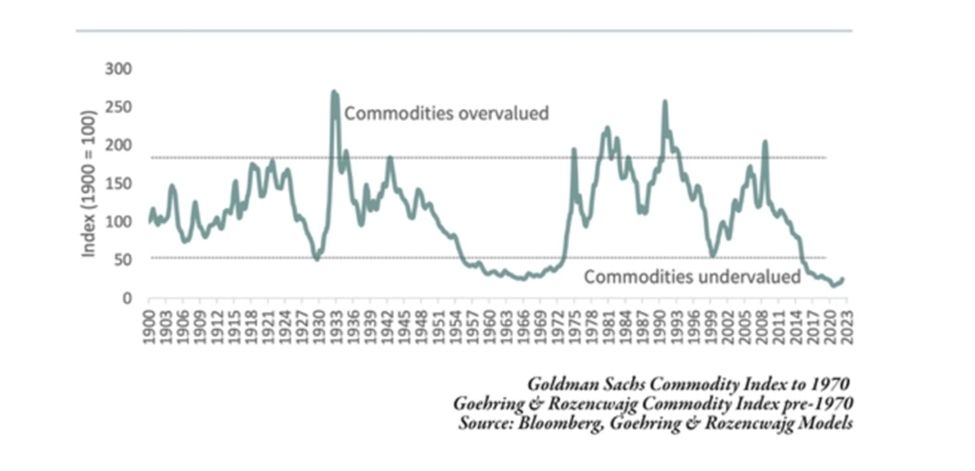
Source: Goehring & Rozencwajg Associates
These four periods, corresponding to the lowest points on the green line, were 1929, the late 1960s, the late 1990s, and today. The key message is that after each stint of undervaluation, commodities entered large bull markets, before becoming overvalued.
Investors who were smart (and brave) enough to invest during undervalued periods saw huge gains, even in the 1930s. For example, investing in a natural resource portfolio (25% metals and mining, 25% precious metals, 25% agriculture, 25% energy) in 1929 would have returned 122% by 1940, clobbering the stock market, which fell 50% during this time.
Rozencwajg notes that every time there has been a major change in the monetary system, it corresponds to a low point in the charts of commodity prices relative to financial assets.
“So here we have another bottom, the cheapest price commodities have ever been relative to financial assets, and we’ve been saying since 2018 there’s going to be a change in the global monetary system and so I think that we’re starting to see that now.”
Such a change has already happened three times in the past century: in 1929, the end of the classical gold exchange standard; in 1971, when President Nixon took the United States off the gold standard; and in 1999, during the Asian currency crisis when several countries in the region competitively devalued their currencies.
Conclusion
Steady demand from central banks confirms that precious metals, in particular gold, deserve investors’ attention. Earlier this year, the gold price flirted with the record-high $2,074.60, set on March 8, 2022.
Experts remain bullish on gold (and silver) for the rest of the year, with a pivot in the Federal Reserve’s rate hike path acting as the next trigger.
Longer term, a “Black swan” event such as the dismantling of the US-dollar-led reserve currency system is easily dismissed, but we have to remember a monetary policy shift is not without precedent — it’s happened three times in the last 100 years.
The end of King Dollar doesn’t mean the US will implode but it would probably result in a long overdue re-balancing of real assets (commodities) to financial assets (stocks and bonds).
Gold and gold stocks are therefore poised to do well, in what appears to be the start of the second leg of a long-term secular bull market.
********
share
share
share
share
share


