
Gold Crawling Amidst The S&P500’s Mauling
 share
share
 share
share
 share
share
 share
share
 share
share
We start with this from the "Honesty is the Best Policy Dept.", for whilst markets all 'round are lurching about, does Gold not seem a bit docile throughout? Pro-Gold as we are, 'tis dutiful for us to point out that price -- as regularly regressed to the changes of the markets that comprise BEGOS (Bond / Euro / Gold / Oil / S&P500) -- actually appears high vis-à-vis our smooth, pearly valuation line as below shown. Again this metric of valuation differs from the core measure (per our opening Scoreboard) of supply-adjusted pricing via currency debasement. Rather, the smooth line we show here is merely a suggested level for Gold per its movement relative to the other four BEGOS components. 'Tis from one year ago-to-date:

The above graphic's good news, (naturally per our long-standing "Trader's Rule of Thumb"), is to ensure one is indeed Long Gold upon price passing up through the smooth line as it last did at 1065 in mid-December, since which Gold has traded as high as 1113, en route to settling this week yesterday (Friday) at 1098. Moreover, per the oscillator (price less valuation) at the foot of the chart, Gold is hardly at an extreme high level -- and further -- the smooth line itself has just started to bend upward. The upshot? Higher still, ("upshot" indeed!).
We see fueling for higher Gold levels as well in this next display of the weekly bars and parabolic trends: behold the new blue dot! (Best not to share this with your Short friends that we've now a Long trend; rather let's squeeze them 'til their untimely end):
As for you "dot counters" out there, the above three red swaths number as follows: 12 weeks, 12 weeks, 11 weeks! (I know, try not to get too excited).
And having mentioned Gold's seeming comparatively docile, (notably given the "death throes" with which stock markets are dealing), it certainly shows so in this next view of the percentage tracks of the yellow metal vs. the S&P 500 over the last 21 trading days (one trading month-to-date):
This same "non-participative" state of Gold also shows stark in the next two-panel display. These are our "expected daily trading ranges" -- not market directions -- in points from one year-ago-to-date for both Gold on the left and the S&P on the right. Quiet days at the office for Gold amidst the perceived S&P chaos:

Bit of a lollygager there, our Gold. But 'tis important to point out that as commodities compress and stocks regress, Gold is instead showing us its true colour: money!
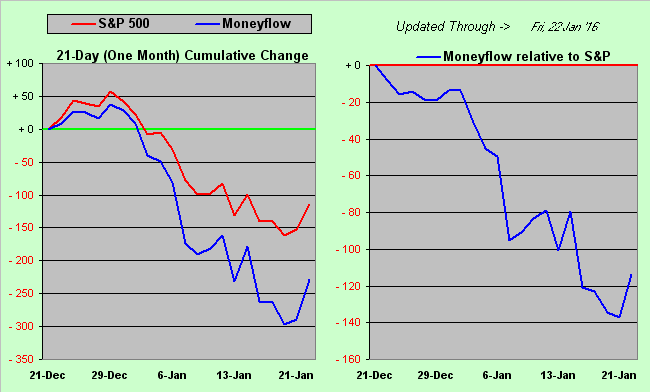
Speaking of stocks, FinMedia headlines are in alarmist mode these days. Why, there's one that ran this past week as "A Simple Guide to Why the Stock Market Is an Unholy Mess This Year". Indeed the WashPost came up with this question: "What on earth is going on with the stock market?" Our answer: nothing really, certainly not over which to fuss or declare as a mess; rather we see it as a perfectly normal, pristine regression to an earnings mean. And Brother, given that our "live" price/earnings ratio for the S&P finished the week at 42.2x, we've an ever so long way to go in paring that back down to a "norm" in the 20s. Yesterday, with the S&P settling Day Two of the Dead Cat Bounce at 1907, even our projected low for this year near 1400 shan't pull down that P/E enough. ('Course, regressing to earnings normality can take years, but at least 'tis underway). For even as Kitty has gone "boing" these past two trading days, our S&P Moneyflow measure is well below the change in the Index itself. The following two-panel graphic shows us on the left the points change in the S&P (red) from one month ago-to-date along with the Moneyflow (blue) regressed into S&P points; on the right is the difference in points between the two (-114). So let's do the math from the current S&P of 1907 - 114 = 1793. Coming soon to a theatre near you:
"Is it showing up in the Econ Baro too, mmb?"
To be sure, 'tis, Squire. Inputs from just this past week included reductions in the National Association of Home Builders' Index, Housing Starts, Building Permits, the CPI going negative, the "Philly Phed" Index remaining negative, jobless claims reaching their highest level since last July, and the "lagging" Leading Economic Indicators turning red. Here's our Economic Barometer:
"But don't forget, mmb, that existing home sales were really good!"
"Used" ain't "new", Squire. And what's really to "forget" are those so-called "lazy set and forget" fund portfolios. You'll wanna forget you ever heard of 'em.
'Course, 'tis not just StateSide economics and portfolios which are heading south. The International Monetary Fund again cut its world growth outlook, albeit both the wealthiest and poorest nations are expected to somewhat pick up, (i.e. the rich get richer, whilst it can't get worse when you ain't got nuttin'). China's economic growth pace has slowed to that of 25 years ago. In France, as joblessness reaches record levels, President Hollande says the country is in "a state of economic and social emergency". Meanwhile from Greece, (remember it?), Prime Minister Alexis "Tie-less" Tsipras desires to break ties with the IMF from further bailouts, on the notion that the EuroZone itself can handle it. What do ya think about that, Angela?
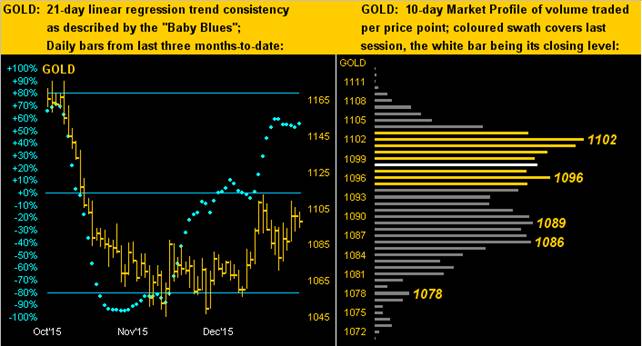
What we think for Gold is, although not (yet) zooming along to the upside, is that 'tis at least fairly firm through here, as below revealed in yet another two-panel chart. Here is our familiar pairing of Gold's daily bars for the past three months (left), the "Baby Blues" climbing higher, albeit somewhat erratically, and thus if you will, with "errant" consistency; the 10-day Market Profile (right) provides a proper platform of support ranging from 1102 down to 1086:
Next let's check out the state of the stack followed by a few quips in wrap:
The Gold Stack
Gold's Value per Dollar Debasement, (from our opening "Scoreboard"): 2543
Gold’s All-Time High: 1923 (06 September 2011)
The Gateway to 2000: 1900+
Gold’s All-Time Closing High: 1900 (22 August 2011)
The Final Frontier: 1800-1900
The Northern Front: 1750-1800
On Maneuvers: 1579-1750
The Floor: 1466-1579
Le Sous-sol: Sub-1466
Base Camp: 1377
Neverland: The Whiny 1290s
Resistance Band: 1240-1280
The 300-Day Moving Average: 1160
Year-to-Date High: 1113
Trading Resistance: 1102
Gold Currently: 1098, (weighted-average trading range per day: 16 points)
Trading Support: 1096 / 1089 / 1086 / 1078
10-Session “volume-weighted” average price magnet: 1094
10-Session directional range: down to 1071 (from 1113, that came 1st) = -42 points or -4%
Year-to-Date Low: 1061
The Weekly Parabolic Price to flip Short: 1045
■ European Central Bank President Mario Draghi did Davos this past week, after asserting that our Federal Reserve Bank's interest rate hike back on 16 December was "flawlessly executed". It brought to mind one of the more infamous quips from the annals of National Football League history back in the early days of the rather terrible Tampa Bay Buccaneers, when their first head coach John McKay was asked what he thought of his team's execution and he replied: "I'm in favor of it." That aside, the world's financial elites and fawning paparazzi came this past week to idyllic Davos, Schweiz, and much like the Fed's Open Market Committee, ruminated in academia as opposed to fact. The best way to take in Davos each year is to simply turn on the FinTélé, but keep the volume off, and enjoy the lovely snowfall.
■ And indeed, the FOMC is to produce a "do nothing" Policy Statement, sans press conference, this Wednesday (27 January). The irrelevancy continues there.
■ An old employment haunt of mine, Barclays, is to layoff some 1000 folks from its investment banking business and shut down its Asian cash equities operations, as Group Chief Executive Jes "Stop The Bleeding" Staley seeks growth through shrinkage. One wonders if we'll see furtherance thereto 'round S&P 1400.
■ Finally, with recovery in the air cargo market having stalled, (something not recommended whilst aloft), Boeing plans to annually bolt together just six of its iconic 747s. Remember those cool Air France 747 Combi jets with passengers fore and cargo aft? You could fly over to Paris to purchase your lifelong-coveted Citroën 2CV (Deux Chevaux), drive it out to Roissy to be loaded into the cargo bay of the Combi with you flying home up front, and drive it back to your palatial StateSide residence the same evening. Those were the days! "Boeing Boeing" --(Paramount Pictures, '65)
share
share
share
share
share

Mark Mead Baillie has had an extensive business career beginning in banking and financial services for two years with Banque Nationale de Paris to corporate research for three years at Barclays Bank and then for six years as an analyst and corporate lender with Société Générale.
For the last 22 years he has expanded his financial expertise by creating his own financial services company, de Meadville International, which comprehensively follows his BEGOS complex of markets (Bond/Euro/Gold/Oil/S&P) and the trading of the futures therein. He is recognized within the financial community of demonstrating creative technical skills that surpass industry standards toward making highly informed market assessments and his work is featured in Merrill Lynch Wealth Management client presentations. He has adapted such skills into becoming the popular author each week of the prolific “The Gold Update” and is known in the financial website community as “mmb” and “deMeadville”.
Mr. Baillie holds a BS in Business from the University of Southern California and an MBA in Finance from Golden Gate University.


