Gold Forecast: Gold Cycles Forming Short-Term Bottom


 Since my last article posted back in early-May (i.e., 'Gold Cycles Move into Mid-Term Topping Range'), Gold has moved sharply lower, with the metal dropping over $150 - into the most recent swing low.
For the mid-term picture, the Gold cycles are deemed to be pointing south, though we are at or near the point at which a smaller-degree rally should soon take hold.
Gold Timing Index
As mentioned in past articles, the path for the mid-term picture called for higher highs into the late-April to mid-May timeframe, before setting up the next key peak for Gold - which was expected to come from the combination of 72 and 310-day cycles.
Back in early-May, I mentioned a key (sell) signal had occurred, coming from our Gold Timing Index - which is shown on the chart below:
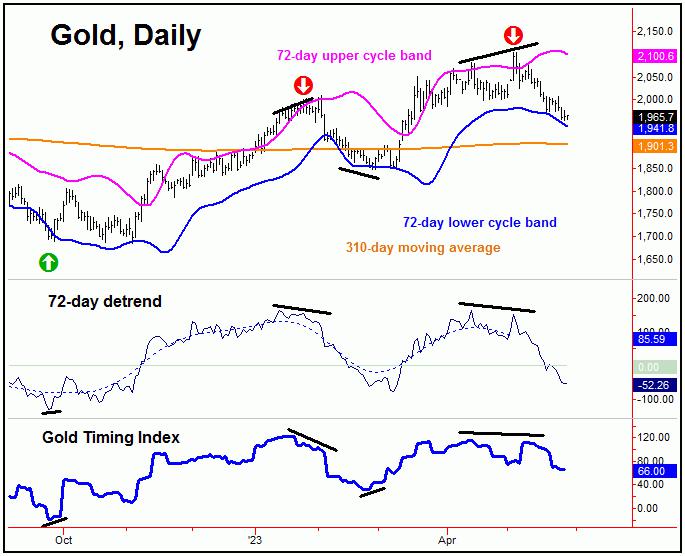
From my 5/8/23 article: "our Gold Timing Index has formed a sizeable divergence from price action - which is something we would expect to see at mid-term peaks with Gold - such as with our 310-day cycle; at minimum, this will normally signal a top with our smaller 72-day component. Going further, a divergence between price and our Gold Timing Index - along with a diverging 72-day detrend (which is also being seen) - will see the lower blue cycle band indicator acting as the minimum magnet on the next correction, with that band currently at the 1961 figure - well below current price levels."
With our Gold Timing Index giving a sell signal back on 5/3/23 - within one trading day of the top for the metal - we were able to exit all open long positions in the GLD, thus avoiding the most recent decline.
In terms of price, the signal from our Gold Timing Index suggested above-average odds that a drop back to or below our lower blue cycle band would be seen (1961, at the time the signal was generated) - which was easily met with the recent decline.
Gold's Mid-Term Cyclical View
As mentioned above, the last mid-term peak was expected to come from the combination of 72-day and 310-day cycles. The chart below shows the position of the smaller 72-day wave:
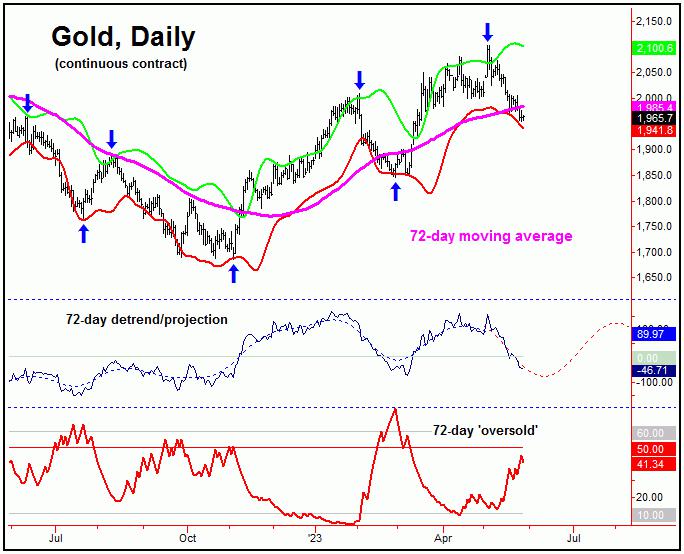
In terms of price, our downside 'reversal point' was broken below, thus triggering in the downward phase of this 72-day cycle - as well as the larger 310-day component. With that, the smaller 72-day wave is pushing south into the mid-June timeframe, plus or minus, where it should bottom out - for the next multi-week rally phase.
Of particular note is that our 72-day 'oversold' indicator (lowest pane, in red) is moving closer to its upper reference line - though it still has some room to move. Since this indicator moves inversely to price (similar to how the VIX moves in regards to the U.S. stock market) - a push above the upper reference line is something normally seen closer to bottoms with this 72-day cycle.
Gold Market, Short-Term
Even with our 72-day wave seen as pointing south into mid-June or later, there will be the normal in-between rallies. That is, even in cyclical downward phases, the market will mount countertrend rallies - the next one we believe Gold is very close to.
The next chart shows why we could be readying to rally, short-term:
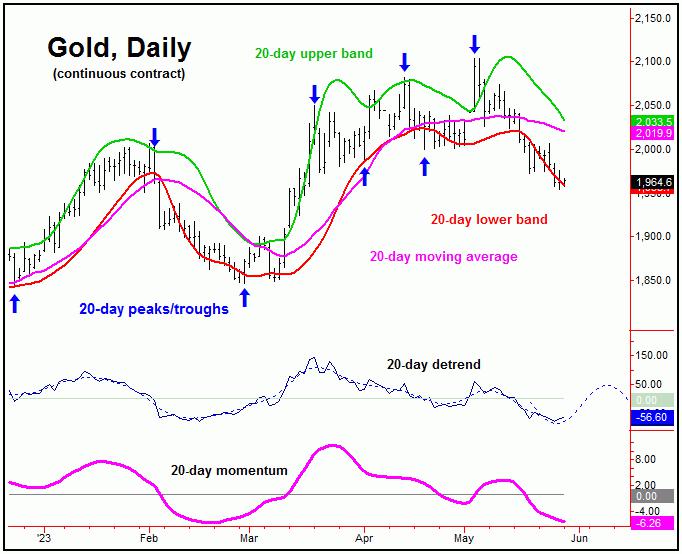
The chart above shows the 20-day cycle for Gold. In looking at the detrend indicator that tracks this wave, we can see that it is right into bottoming territory - and thus is readying for a decent rally, at least near-term.
Going further with the above, following my rule that a cycle will normally (i.e., 85% of the time) revert back to a moving average of the same length, the potential upside is back to the 20-day moving average, and/or the upper 20-day cycle band - each around the low-end 2000's for Gold.
In other words, the potential upside for the near-term is back to the 20-day moving average or better, though - due to the position of the larger 72-day component - that rally would be favored to end up as a countertrend affair.
If the above assessment is correct, another push south would be seen into mid-June or later, before setting up a more key short-term bottom with the metal. This low could be triggered by our Gold Timing Index, and is something we will be watching very closely as we move into that timeframe. Stay tuned.
Jim Curry
The Gold Wave Trader
http://goldwavetrader.com/
http://cyclewave.homestead.com/
********


