Gold Forecast: Gold Cycles Move into Mid-Term Topping Range
 share
share
 share
share
 share
share
 share
share
 share
share
 Since my last article, Gold has managed to make a new high for the larger swing, with the metal running all the way up to a peak of 2085.40 (June, 2023 contract), made in last Wednesday's session - before seeing a decent pullback off the same. For the mid-term picture, the Gold cycles are back into topping range.
From my April 16th article: "In terms of price, a statistical analysis of the smaller 72-day wave has suggested the potential for a spike up to the 2080's or better before the next mid-term peak was made. With the above said and noted, there could still be a final spike back to a higher high before completing the upward phase of this 72-day wave. In terms of time, our original assessment favored higher highs into the late-April to mid-May timeframe."
As mentioned in some of my past articles, our ideal path for the mid-term picture called for a push back above the 2063.40 high into the late-April to mid-May region, before setting up the next key peak for Gold - expected to come from the combination of 72 and 310-day cycles.
The chart below shows the position of the smaller 72-day wave:
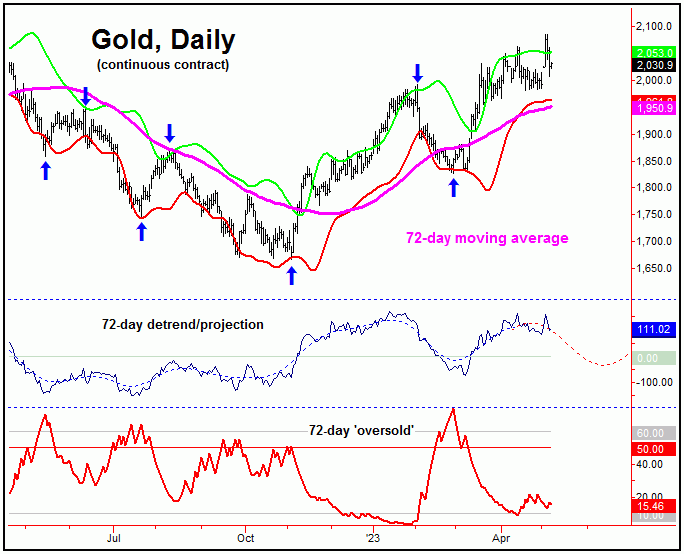
Back in late-January I mentioned that our 72-day cycle was into topping range, as per my article 'Gold Bracing for First Correction of 2023'. In terms of price, a drop back to the 72-day moving average or lower expected to play out into late-February - which was obviously seen with the action that followed.
In terms of patterns, the decline into the last 72-day trough was anticipated to end up as a countertrend affair - before giving way to higher highs on the following upward phase of this wave. This action was satisfied, with Gold holding the decline into late- February well above the November, 2022 trough.
In terms of price, I mentioned back in March that the average rallies with this 72-day cycle were some 14% off the bottom, thus suggesting the potential for a spike up to the 2080's on the current upward phase of this wave - which has also been met, with the push up to the 2085.40 figure into last week.
With the above said and noted, any and all upside price and time assumptions have now been met with the mid-term cycles for Gold. The metal may well have topped the mid-term at the 2085.40 swing high, though this is speculation for now - and has yet to be confirmed.
Shown below again is our larger 310-day cycle component:
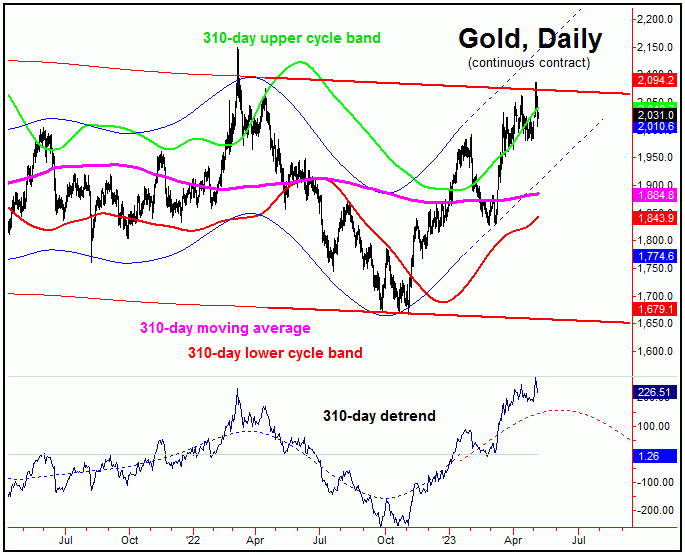
The next mid-term correction is now due - and is expected to come from this 310-day cycle. In terms of price, the low-end declines with this wave have been 14% from peak-to-trough, though with the average declines being closer to 20% off the top. Thus, the downside 'risk' for the coming months is for a correction of 14-20% for Gold.
For the longer-term, however, the coming correction with this 310-day wave is favored to end up as another countertrend affair. If correct, its next upward phase should see another rally of some 20% or more playing out into the Summer of 2024.
Having said the above, there are indications that the next upward phase could be a much greater-percentage rally than this statistical average is suggesting, for reasons we will go to in a future article.
The Technical Picture
With the new price high into last week, we need to take a look again at our Gold Timing Index, which is shown on the next chart, below:
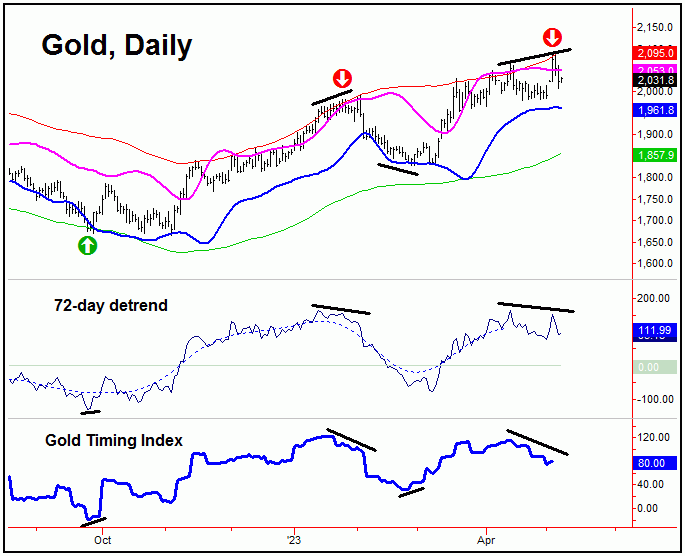
At the most recent new high, our Gold Timing Index has formed a sizeable divergence from price action - which is something we would expect to see at mid-term peaks with Gold - such as with our 310-day cycle; at minimum, this will normally signal a top with our smaller 72-day component.
Going further with the above, a divergence between price and our Gold Timing Index - along with a diverging 72-day detrend (which is also being seen) - will see the lower blue cycle band indicator acting as the minimum magnet on the next correction, with that band currently at the 1961 figure - well below current price levels.
For the mid-term outlook, we are now awaiting confirmation of a bigger turn having occurred with our 310-day time cycle - by taking out a key price/reversal figure to the downside - with the exact details always posted in our thrice-weekly Gold Wave Trader report. Stay tuned.
Jim Curry
The Gold Wave Trader
http://goldwavetrader.com/
http://cyclewave.homestead.com/
**********
share
share
share
share
share


