Gold Forecast: Gold Set For Bigger Rally Phase


 Recapping Last week
Last week's trading saw Gold forming its low in Monday's session, here doing so with the tag of the 1785.00 figure. From there, a sharp rally was seen into later in the week, with the metal pushing all the way up to a Thursday high of 1748.20 - before consolidating the action into Friday.
Gold Market, Short-Term
As mentioned in my prior article, the downward phase of the 10 and 20-day cycles was seen as in force, though were at or into normal bottoming range. Here is the smaller of these two waves, the 10-day component:
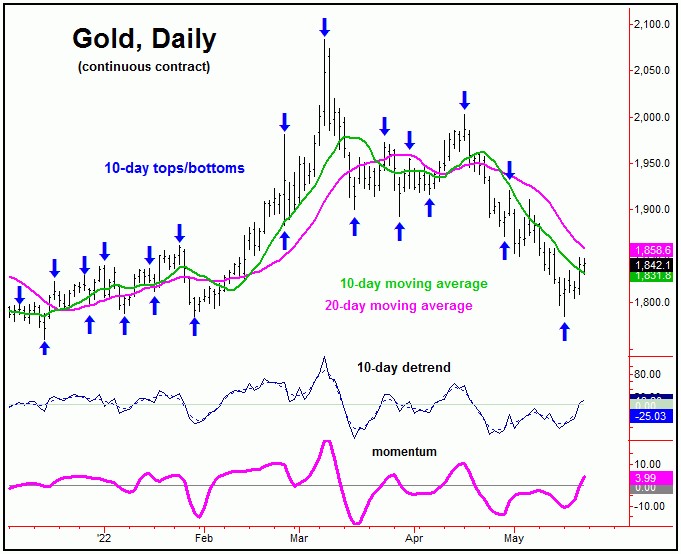
With that, the action into last Tuesday actually favored these waves to have bottomed, an assessment which called for a minimum rally back to the 10-day moving average for Gold - and which was easily met with into Thursday' session.
Having said that, with the 20-day cycle expected to bottom with the 10-day wave, the more ideal path would call for additional strength - on up to the higher 20-day moving average in the near-term, which could also act as a resistance level.
Gold Set for Larger Rally
Stepping back, the next rally of real significance has been expected to come from the larger 72-day cycle, which is shown again on the chart below:
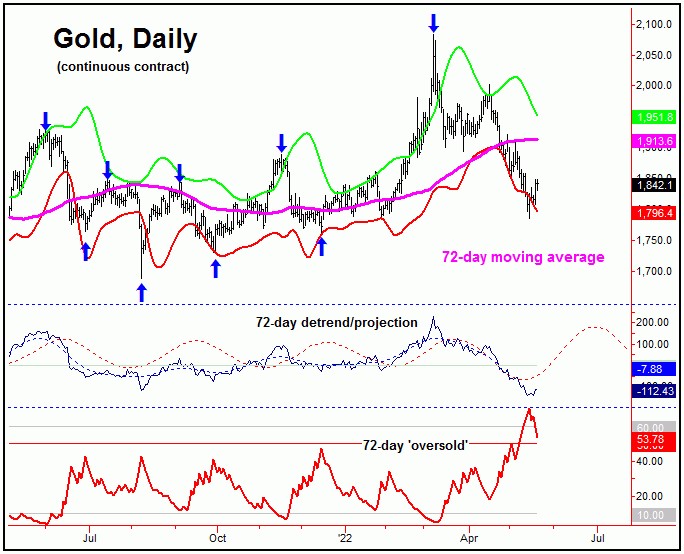
Of note is that our 72-day 'oversold' indicator recently spiked above its upper reference line - along with the metal seeing a daily close below the lower 72-day cycle band. From the comments made in recent articles, this pattern/setup is something often seen near key lows for this 72-day component.
With the above said and noted, it is possible that our 72-day cycle has bottomed, though this has yet to actually be confirmed, by a key number that we are watching in our Gold Wave Trader report. Once this wave does turn, the average rallies with the same have been 14% off the low, lasting an average of 40 trading days before topping.
Going further with the above, the normal minimum rally with the 72-day cycle would see the 72-day moving average acting as the upside magnet. Taking this, in addition to the aforementioned statistical inferences, should give us some idea of what to expect as we head into the Summer of this year. Stay tuned.
Jim Curry
The Gold Wave Trader
http://goldwavetrader.com/
http://cyclewave.homestead.com/
********


