Gold Forecast: Gold Short-Term Dip, Then Higher


 Recapping Last week
Last week's trading saw Gold forming its bottom in Monday's session, here doing so at the 1786.90 figure. From there, a sharp rally was seen into mid-week, with the metal running up to a Wednesday high of 1824.60 - before backing slightly off the same into the weekly close.
Gold, Short-Term
From the comments made in past articles, the last key low for Gold came from the 10, 20 and 34-day cycles, which bottomed out with the July 22nd tag of the 1696.40 figure (December, 2022 contract). From that low, our outlook called for a significant short- term rally for the metal, which we have obviously seen.
From last weekend: "In terms of price, the 72-day moving average was mentioned as the ideal upside magnet - which is around 36 points above current price levels. With that, the overall assumption is that Friday's pullback will end up as countertrend, giving way to strength again - and higher highs for the move - on the next minor swing up, ideally lasting into mid-month or later."
As mentioned last weekend, the probabilities favored the most recent short-term dip to end up as a countertrend affair, with the 72-day moving average acting as the magnet to the next swing up. With the action seen into last week, we have now met this (72-day moving average) expectation - and thus are now back into short-term topping zone.
The chart below shows our in-between cycle, the 20-day component:
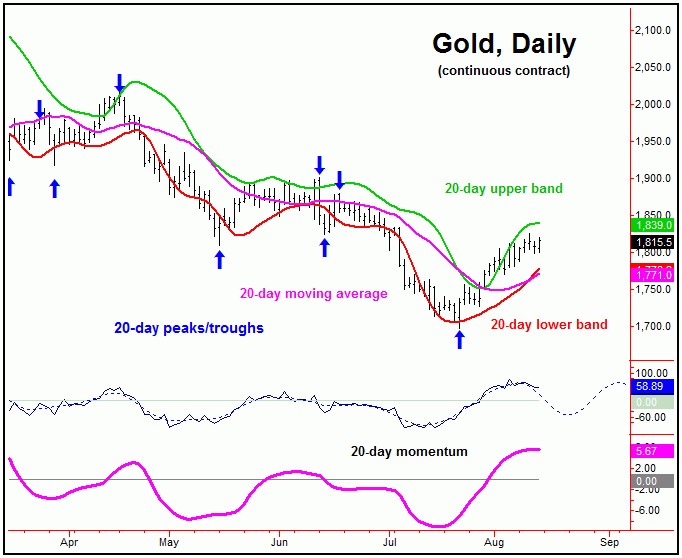
With the above said and noted, the next short-term peak for Gold is now expected to form at anytime - coming from the combination of 10 and 20-day cycles. In terms of price, our Gold Wave Trader noted key resistance to the move at the 1824-1833 region, which was moved into last Wednesday - and which halted the rally for a quick decline into Thursday's session.
Even with the above, it is too early to actually confirm a 10 and 20-day peak to be set in place, though any reversal below the 1797.00 figure (December, 2022 contract) would be our best indication of a turn south with the same.
In terms of price, the next downward phase of the 10 and 20-day cycles is favored to drop back to the 20-day moving average before bottoming, a move which seems likely to end up as countertrend. Support to that decline would also be at or near this same 20-day moving average and/or the lower 20-day cycle band.
Gold's Stepped-Back View
Stepping back slightly, a countertrend dip with the 10 and 20-day cycles in the days ahead - if seen as noted - would be favored to give way to higher highs on the next swing up with these waves. In terms of time, that action would likely put us into the late-August to very early-September timeframe, then to be on the lookout for the next peak with the larger 72-day cycle, shown below:
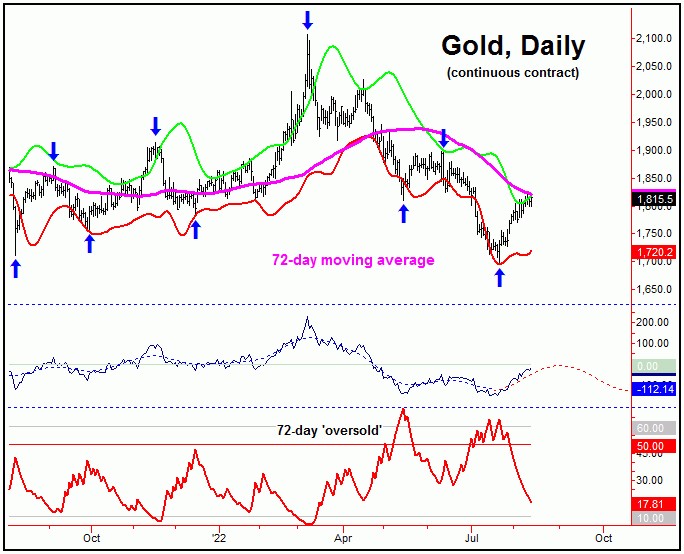
With the above said and noted, following a short-term dip with the 10 and 20-day cycles, the probabilities now favor higher highs with our 72-day wave into the late-August to early-September timeframe. If we are making higher highs with this 72-day wave into that region, then we will need to be on the lookout for key technical signs that this cycle is topping.
One of the key technical signs that we like to watch is our 72-day 'oversold' indicator. Since this indicator moves inversely to price action, a drop below this lower line would be an indication this particular wave is peaking. Stepping back, the next trough for our 72-day cycle - if made on schedule - is due around October of this year, which now looks to be the next key timeframe for the metal. Stay tuned.
Jim Curry
The Gold Wave Trader
http://goldwavetrader.com/
http://cyclewave.homestead.com/
********


