Gold Market Update


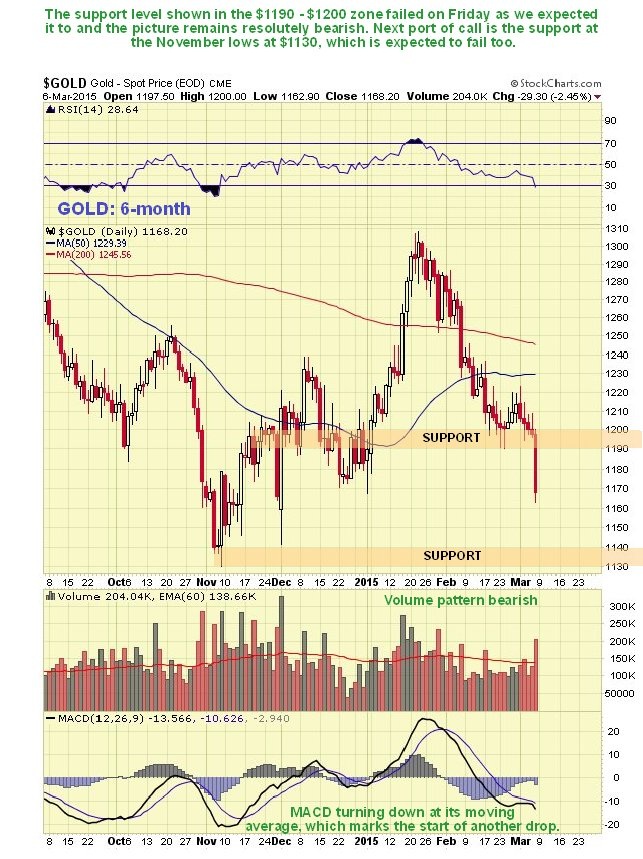
Gold did almost exactly what we expected in the last update, it bounced from oversold off the support at $1190 - $1200, only to break sharply to new lows on Friday, crushed by the strength of the dollar. We got with the plot and are doing fine with bear ETFs, one of which rose by 22% on Friday alone. The dollar is remarkably strong especially given that its COTs and sentiment readings are already bearish by normal standards, so what is going on? - and where is the dollar headed?
The dollar is so strong because the world economy is about to finally disappear into the deflationary vortex, which our illustrious leaders have been fighting tooth and nail for so long now, which they should as they got us all into this mess in the first place.
The game’s over – everyone and everything is maxed out on credit with extend and pretend having been taken to its ultimate conclusion. The misallocated capital from the worldwide orgy of QE has powered an immense carry trade that has driven asset prices to incredible extremes, and the only thing that has kept the game going is very low interest rates, and in the case of the US stockmarket by buybacks by management intent on running up the prices of their stock options, but the situation is now so desperate that rates are at 0 and even running negative in some places. Central Banks are stuffing QE into the gullet of the world economy like they are force feeding a goose, but still they can’t stop the forces of deflation, which are gathering in strength and now closing in for the kill.
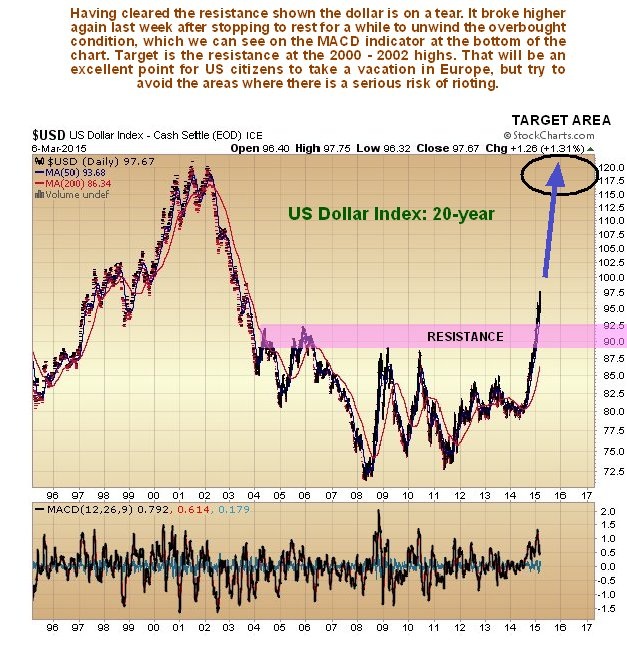
The continuing unwind of the global carry trade is what is driving the dollar higher and higher, and the higher it goes, the more it encourages money to abandon developing markets and return home to the dollar, a classic vicious circle. Where is the dollar index going to end up as a result of this? – an educated guess is the 120 area. For starters have a look at the long-term dollar index chart below which shows a projected target…
If this is what is going to happen to the dollar, then what does it mean for investors, in the simplest terms? It means that cash (the dollar) is King, for a while anyway, and just about everything else is going to collapse, including gold silver and oil, as in 2008 only much worse, because the ammunition that was available then to mount the great extend and pretend campaign ever since has been exhausted. These days, however, we can do a lot better than simply scurry to the safety of the dollar, like scared rabbits. You don’t have to get out of your depth selling short or buying Puts, if you don’t want to, you can simply buy bear ETFs in just the same way as you buy stocks, and by selecting either leveraged or unleveraged ones, you can choose the level of risk that you are comfortable with.
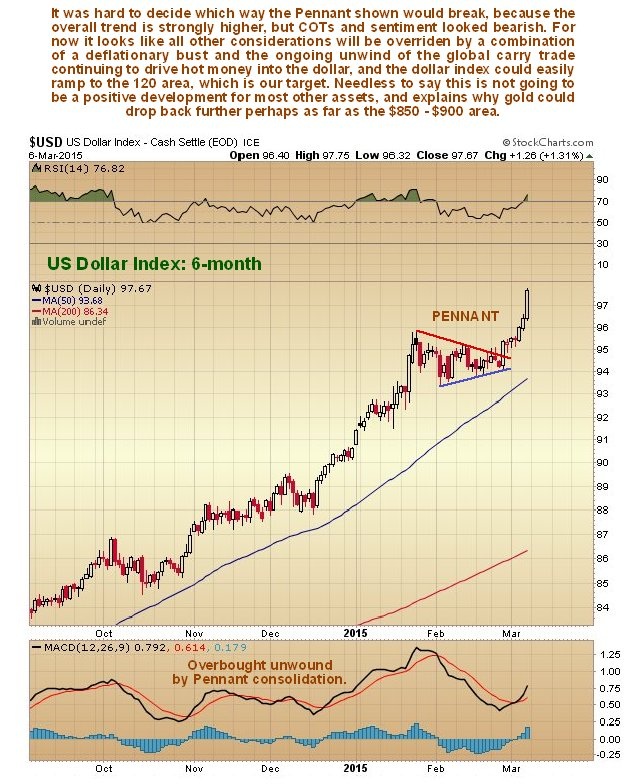
The 6-month chart for the dollar index shows that is on its way again, having broken out upside from a bull Pennant just over a week ago. The near-term target for this move, on an equal move basis, is about 102 and it could easily exceed this as it is a minimum objective.
Let’s now review the chart. On gold’s 6-month chart we can see how it stalled for time at the support at $1190 - $1200 for a couple of weeks, which allowed its oversold condition to unwind a little, but then broke sharply lower on Friday in response to extraordinary dollar strength. It’s next port of call should be the support at $1130 - $1140 at its lows of last November, which are expected to fail in due course too.
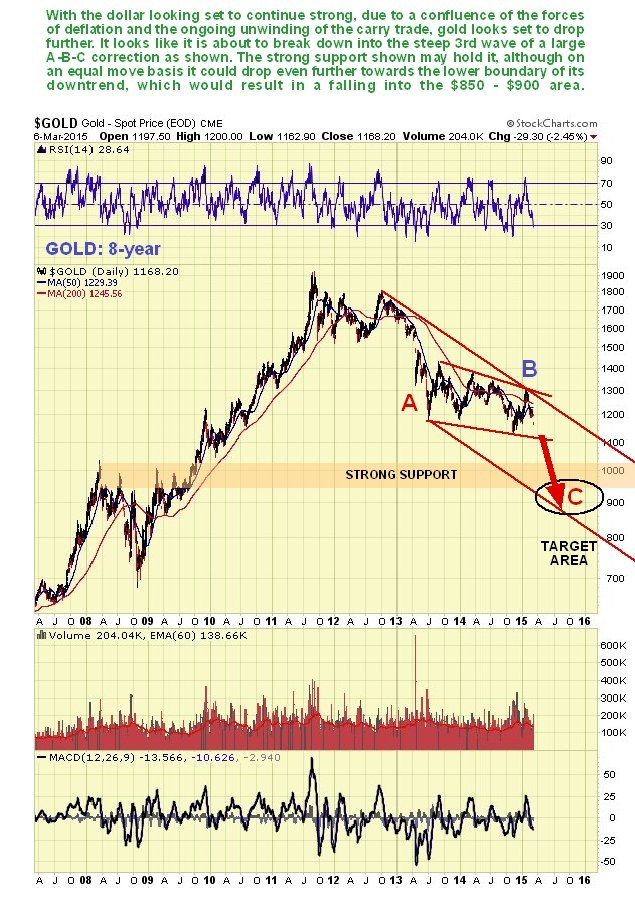
On its 8-year chart gold continues to look weak and like it is setting up for another steep drop at least to its strong support in the $1000 area and possibly lower to the lower boundary of the downtrend channel shown, which would put it somewhere in the $850 - $900 price zone. This would hardly be surprising if the dollar index continues to rally hard towards our price objective in the 120 area. We had concluded in the last update that a giant 3-wave reaction is unfolding in gold, with the C-wave expected to unfold in a similar manner to the A wave which occurred early in 2013, and nothing has happened since to change this outlook, except that it looks even more likely after last Friday’s support failure and sharp drop. On the positive side this C-wave should mark the end of gold’s bearmarket, although here we should note that if the deflationary collapse is really bad, gold could temporarily go even lower than our downside target detailed here. We will be watching closely to see how it pans out when we get there, as it should present an exceptional buying opportunity.
On gold’s latest COT chart we see that Commercial short and Large Spec long positions have moderated, but not by enough to prevent further serious losses…

The Gold Hedgers chart is in middling ground and doesn’t provide much guidance one way or the other…

Chart courtesy of www.sentimentrader.com
The latest Gold Optix chart is fairly bullish, but not enough to spare gold from another drop, and on any such drop it should of course improve significantly.
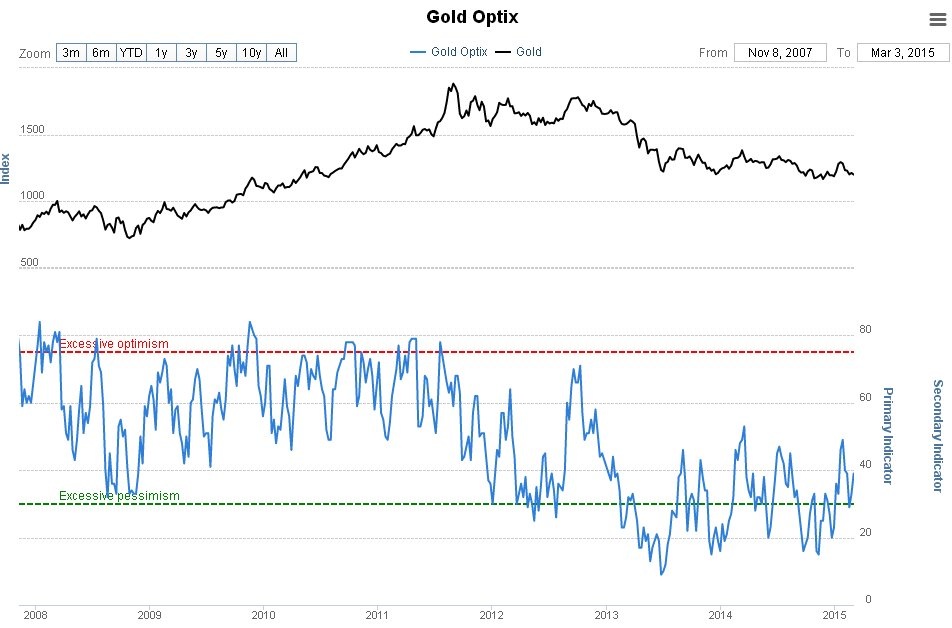
Chart courtesy of www.sentimentrader.com
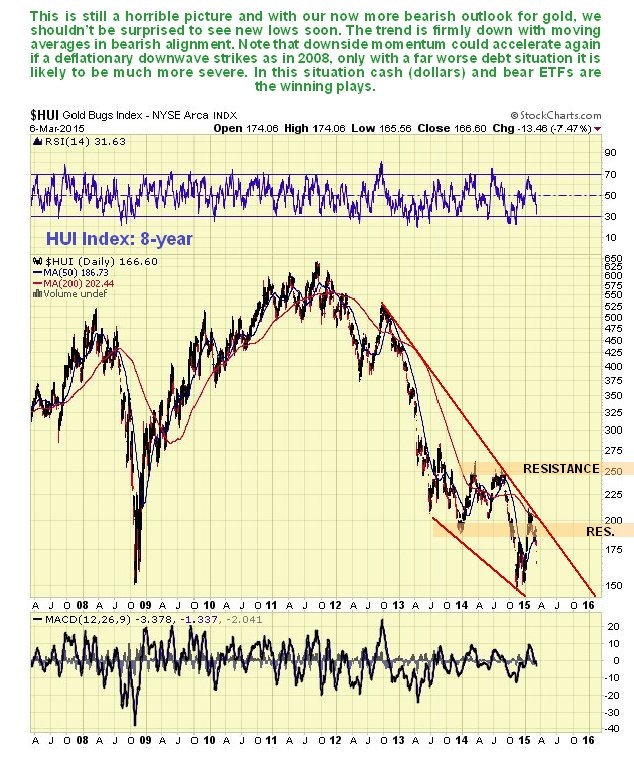
The latest 8-year chart for the HUI index still looks pretty awful, with a severe downtrend in force and its moving averages in bearish alignment. Since it is not now oversold on its MACD indicator shown at the bottom of the chart, it could easily break to new lows and plunge from here, which looks likely given the outlook for gold. The first step towards its negating this bearish scenario will be for it to break out upside from the downtrend channel shown.
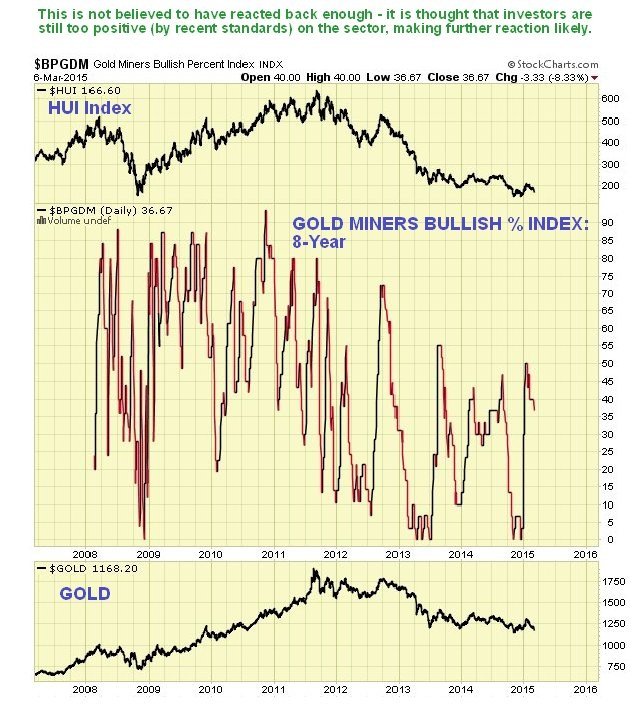
The latest chart for the Gold Miners Bullish Percent Index shows that investors haven’t thrown in the towel yet on PM sector stocks. They are still too bullish by recent standards, which is not a good sign.
It is vitally important that no matter how much you love gold or silver, you maintain a detached and objective attitude to it, if you are to avoid losses and maximize gains. All investing is an opportunity cost game, and to the pure speculator it doesn’t matter if something is rising or falling in price as long as he is on the right side of the trade. It is in this spirit that we bought a range of bear ETFs in the Precious Metals sector early last week, including this one, which rose in price by over 22% on Friday’s sector breakdown…

What we would like to do with this is ditch it for a handsome profit at the bottom and reverse position to long. The challenge will be to recognize the bottom.
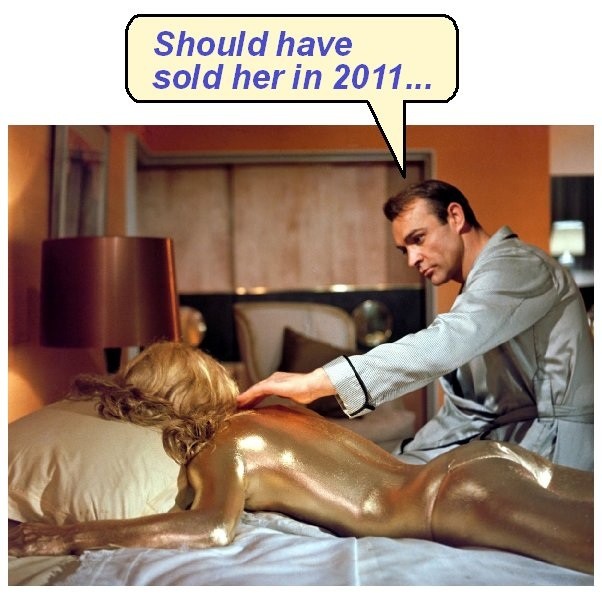
Finally we should not underestimate the sheer pleasure of ownership that gold bestows. Take Mr Bond in the picture below, for instance. He knows he should have sold this girl in 2011 but he just couldn’t bring himself to – and who can blame him? – but he could have hedged of course. Who knows, perhaps he did.
Courtesy of clivemaund.com

Clive P. Maund’s interest in markets started when, as an aimless youth searching for direction in his mid-20’s, he inherited some money. Unfortunately it was not enough to live a utopian lifestyle as a playboy or retire very young. Therefore on the advice of his brother, he bought a load of British Petroleum stock, which promptly went up 20% in the space of a few weeks. Clive sold them at the top…which really fired his imagination. The prospect of being able to buy securities and sell them later at a higher price, and make money for doing little or no work was most attractive – and so the quest began, especially as he had been further stoked up by watching from the sidelines with a mixture of fascination and envy as fortunes were made in the roaring gold and silver bull market of the late 70’s.
Clive furthered his education in Technical Analysis or charting by ordering various good books from the US and by applying what he learned at work on an everyday basis. He also obtained the UK Society of Technical Analysts’ Diploma.
The years following 2005 saw the boom phase of the Gold and Silver bull market, until they peaked in late 2011. While there is ongoing debate about whether that was the final high, it is not believed to be because of the continuing global debasement of fiat currency. The bear market since 2011 is viewed as being very similar to the 2-year reaction in the mid-70’s, which was preceded by a powerful advance and was followed by a gigantic parabolic price ramp. Moreover, Precious Metals should come back into their own when the various asset bubbles elsewhere burst, which looks set to happen anytime soon.
Visit Clive at his website: CliveMaund.com
More from Gold-Eagle


