Gold Market Update


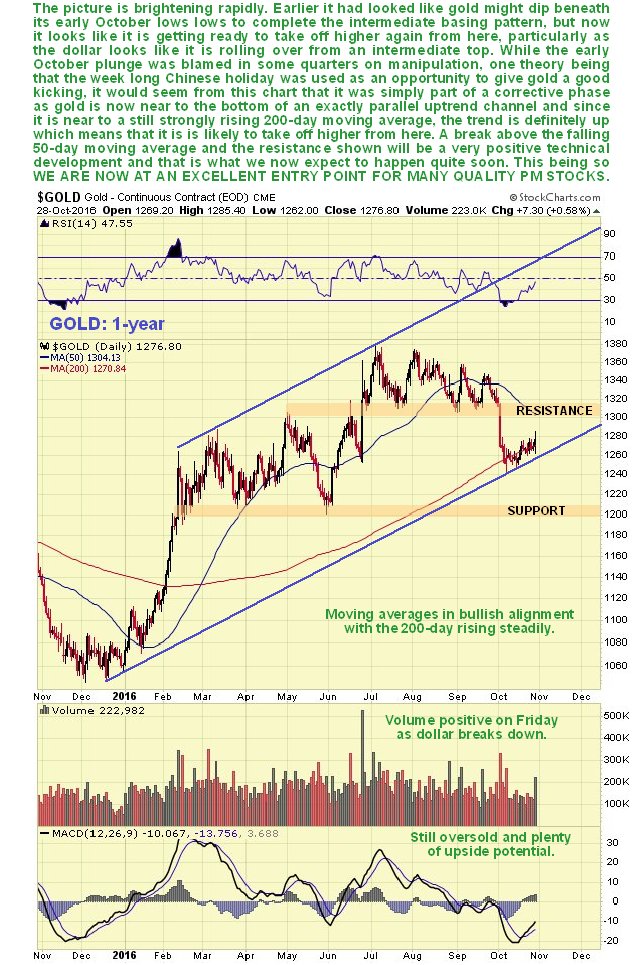
It now looks like gold’s correction is done and its intermediate base pattern is completing, and if so then we are at an excellent entry point for many better PM stocks, which have been savagely beaten down over the past several months - a necessary correction following their outsized run-up earlier in the year.
On its 1-year chart we can see that gold’s corrective action from early July has brought it all the way back to its steadily rising 200-day moving average, a classic buy spot, where a potential intermediate base has formed. This corrective action has more than completely unwound the earlier overbought condition and it may well be that the price is bottoming at the lower boundary of the large parallel uptrend channel shown, and that is what various factors suggest. These factors are the major uptrend still in force as symbolized by the rising 200-day moving average already alluded to, the bullish alignment of moving averages, the price being at the lower boundary of the prospective channel shown, the earlier overbought condition having unwound, and finally the dollar looking like it is breaking down from its uptrend of the past month, which we will look at later.
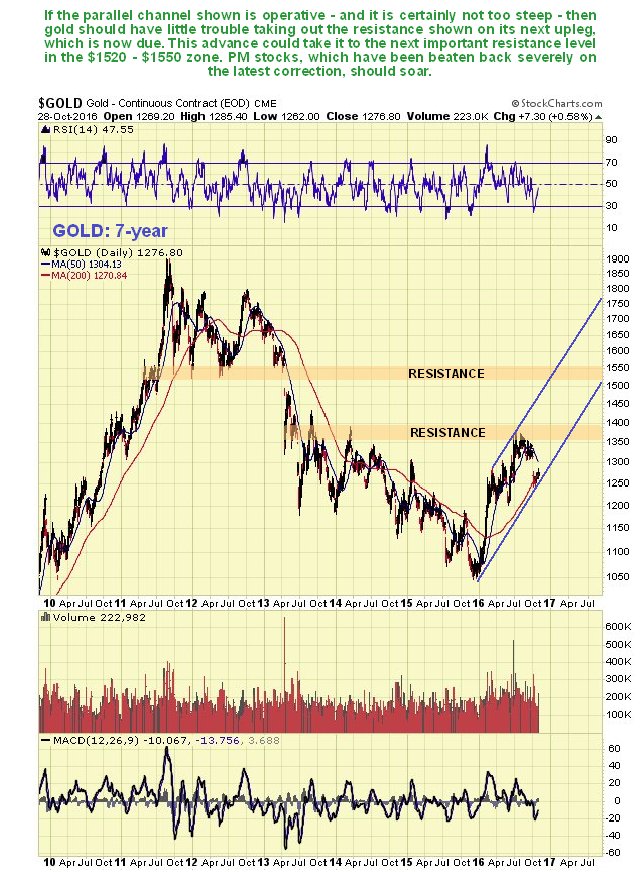
The 7-year chart for gold shows its new bull market in the context of the preceding bear market from the 2011 highs. This new bull market ran into trouble at the 1st resistance level shown, but after the recent correction it should now gather itself to take out this resistance on the next upleg, and target the next resistance level in the $1520 - $1550 zone. Needless to say, an advance to this objective will result in PM stocks, which have been severely beaten back on the correction, soaring to much higher levels. If this interpretation is correct, then we are at an excellent entry point for many PM stocks RIGHT NOW.
The 20-year gold chart is interesting, as it makes plain that the 2011 – 2015 bear market is really nothing more than a correction to the giant bull market from 2001 that preceded it. It also shows that this giant correction ended right at the zone of strong support shown just above the zone of extensive trading that occurred in 2008 – 2009, a very good point for it to reverse to the upside. The new bull market that is believed to have begun early this year should take gold way above its previous highs in the $1900 area.

Another possible bullish factor for gold here is that the dollar appears to be breaking down from its uptrend that started at the beginning of the month, with an increasing risk that it will drop back across its range. We can see this to advantage on the year-to-date chart for the dollar index.

The 3-year chart for the dollar index shows that it’s still no change for the dollar, as it remains stuck in the giant trading range that started to form back at the March 2015 peak. Right now, having approached the resistance again at the top of the range, it looks like it is rolling over to drop back across the range again, which will be good news for gold.

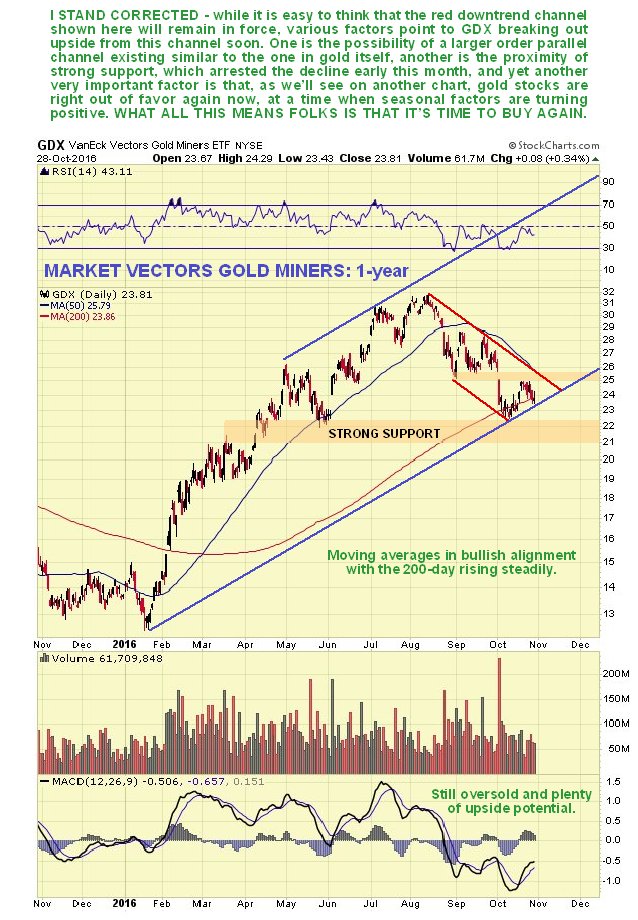
The 1-year chart for GDX is most interesting. Many would-be PM sector stock buyers are currently deterred from doing so by seeing that the red downtrend shown on our chart is still in force. However, it is very possible that this index is close to the lower boundary of the larger order uptrend channel shown, which is of course closely related to the parallel channel that we have observed on the 1-year gold chart. If so then we are clearly at a very good point to buy, as the index will go on to break out upside from the red channel, and various factors strongly suggest that this is what is going to happen. In the first place, the index is close to a zone of strong underlying support, which arrested the decline early this month. Secondly the 200-day moving average is still rising strongly, which shows that the major trend is still up, and moving averages are definitely in bullish alignment, with any rally now turning the 50-day up above the 200-day. Thirdly stocks are still oversold, after correcting back from being heavily overbought early in July, and last but not least most would-be investors in the sector are cringing timidly in the shadows as they usually are after a sharp drop – it’s their right to buy high and nobody and nothing is going to stop them. This is made abundantly plain by the Gold Miners Bullish Percent Index chart, which we will look at next.
Finally, for those of you who are still feeling leery of buying gold stocks here, take a look at the latest Gold Miners Bullish Percent Index chart, which shows that sentiment has dropped from “foaming at the mouth” 100% bullish back in early July, when to many there was no sign of the impending sharp correction, to a paltry 18% bullish now. Ask yourself if you felt more bullish towards the sector back early in July than you do now, and you will have the answer to whether you should buy the sector now. Sure, it could drop more from here, but technically it’s a lot less likely than it was back in July – much more likely is that a big rally starts soon.

There has been a lot of action in the “Green Gold” space too. Some of our stocks in this sector have made phenomenal gains with General Cannabis, for example, rising by about 2000% since it was recommended on the site back in March, and recent rec Massroots up by 55% in 2 weeks. Those of you who are interested in learning more about the continuing major opportunity in the marijuana sector, resulting from the explosive growth in medical and recreational marijuana use due to the dramatic easing of legal restrictions, are invited to download the special Green Paper we have prepared for this purpose by clicking on this link. Right now gold and silver are thought to be powering up for another major upleg, hence these latest updates.
********
Courtesy of Courtesy of http://www.clivemaund.com

Clive P. Maund’s interest in markets started when, as an aimless youth searching for direction in his mid-20’s, he inherited some money. Unfortunately it was not enough to live a utopian lifestyle as a playboy or retire very young. Therefore on the advice of his brother, he bought a load of British Petroleum stock, which promptly went up 20% in the space of a few weeks. Clive sold them at the top…which really fired his imagination. The prospect of being able to buy securities and sell them later at a higher price, and make money for doing little or no work was most attractive – and so the quest began, especially as he had been further stoked up by watching from the sidelines with a mixture of fascination and envy as fortunes were made in the roaring gold and silver bull market of the late 70’s.
Clive furthered his education in Technical Analysis or charting by ordering various good books from the US and by applying what he learned at work on an everyday basis. He also obtained the UK Society of Technical Analysts’ Diploma.
The years following 2005 saw the boom phase of the Gold and Silver bull market, until they peaked in late 2011. While there is ongoing debate about whether that was the final high, it is not believed to be because of the continuing global debasement of fiat currency. The bear market since 2011 is viewed as being very similar to the 2-year reaction in the mid-70’s, which was preceded by a powerful advance and was followed by a gigantic parabolic price ramp. Moreover, Precious Metals should come back into their own when the various asset bubbles elsewhere burst, which looks set to happen anytime soon.
Visit Clive at his website: CliveMaund.com


