Gold Market Update


In Britain in the old days there was a saying, which was “buy on a strike” which had nothing to do with economics and everything to do with psychology. When a general strike by workers was declared, stock prices would have fallen up to the point at which the strike started, when the economic outlook would have been at its worst, but well before the strike ended they would actually start rising again, as investors perceived an eventual resolution of the problems. Thus, savvy investors who bought when things looked at their worst would have made the best of the situation.
The same thing works in reverse when gold and silver look like they are going to rise due to a ramp up in geopolitical tensions. Thus, early yesterday, we had any number of market commentators and “green” investors declaring a breakout by gold and silver due to the apparently increased danger of conflict between Russia and the US after Trump lobbed about 50 cruise missiles at a Syrian airbase. Trump had 3 main reasons for initiating this strike. One is that he appears to have been genuinely outraged at the chemical attack having seen film of the victims of it, and wanted to hit back at those he saw as the perpetrators. The second is that it couldn’t do any harm to his flagging ratings in the polls, and was likely to boost them, and the third was that loosing off 50 Tomahawks at $1 – $2 million a pop is a good way of replenishing order books, and doubtless won him some powerful friends at Raytheon.
Since the cruise missile attack on the Syrian airbase may be a “one-off” and tensions are likely to ease going forward, any positive impact on gold and silver prices is likely to fade fast, and in fact it already started to before trading was done yesterday, as we will now see on the charts. So it could be said that what we talking about here is a “sell on a strike” situation, selling the PM sector on a missile strike rather than buying the broad market on a labor strike as in Britain in the distant past.
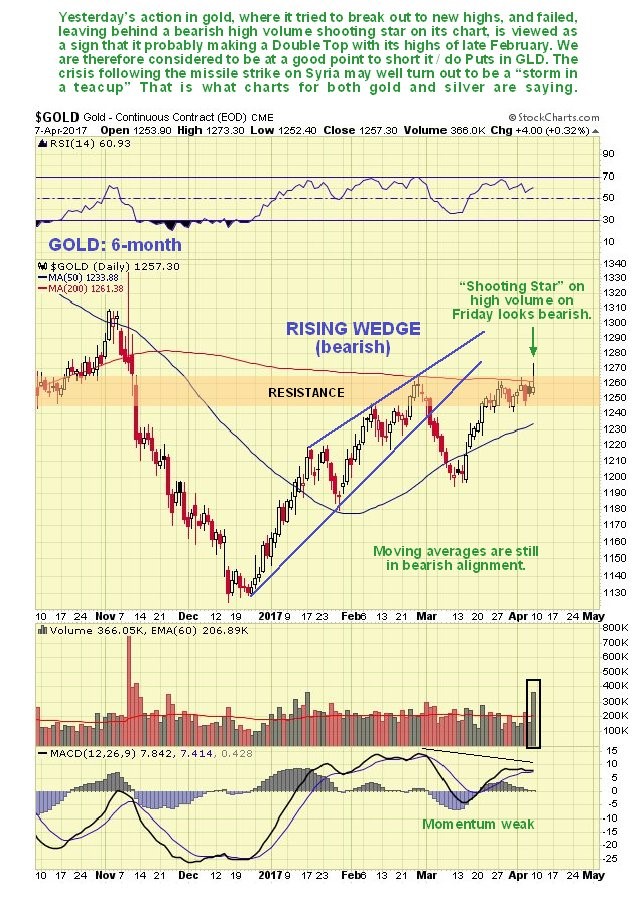
On gold’s 6-month chart we can see that it did actually break out in the early trade yesterday, above a line of resistance and its 200-day moving average, but it couldn’t hold it – the breakout failed leaving behind a bearish “shooting star” candlestick on the chart, which occurred on the 2nd highest volume this year.
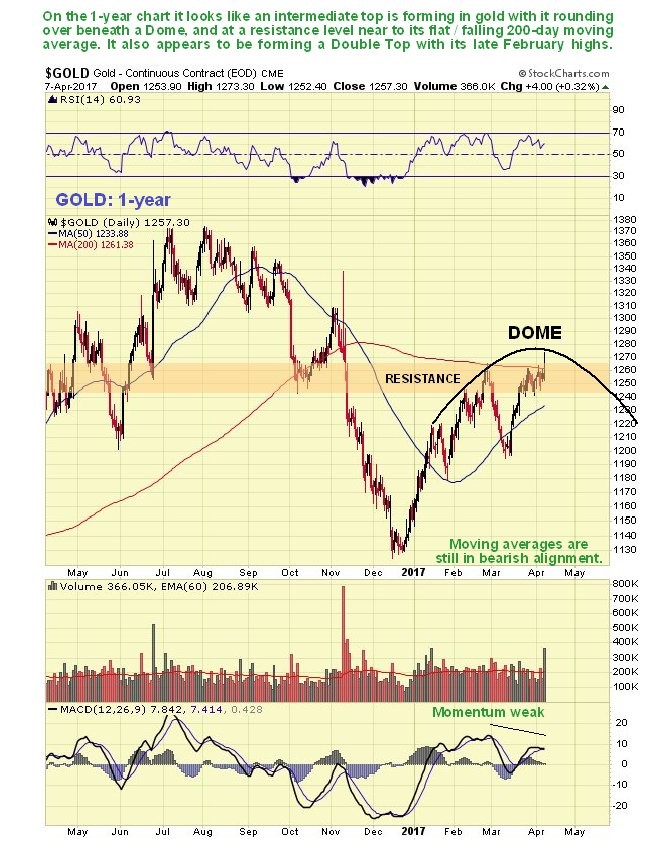
On the 1-year chart it looks like gold is forming an intermediate top here, as it is rounding over beneath a resistance level, and close to its flat / falling 200-day moving average, with moving averages still in bearish alignment, and upside momentum weak.
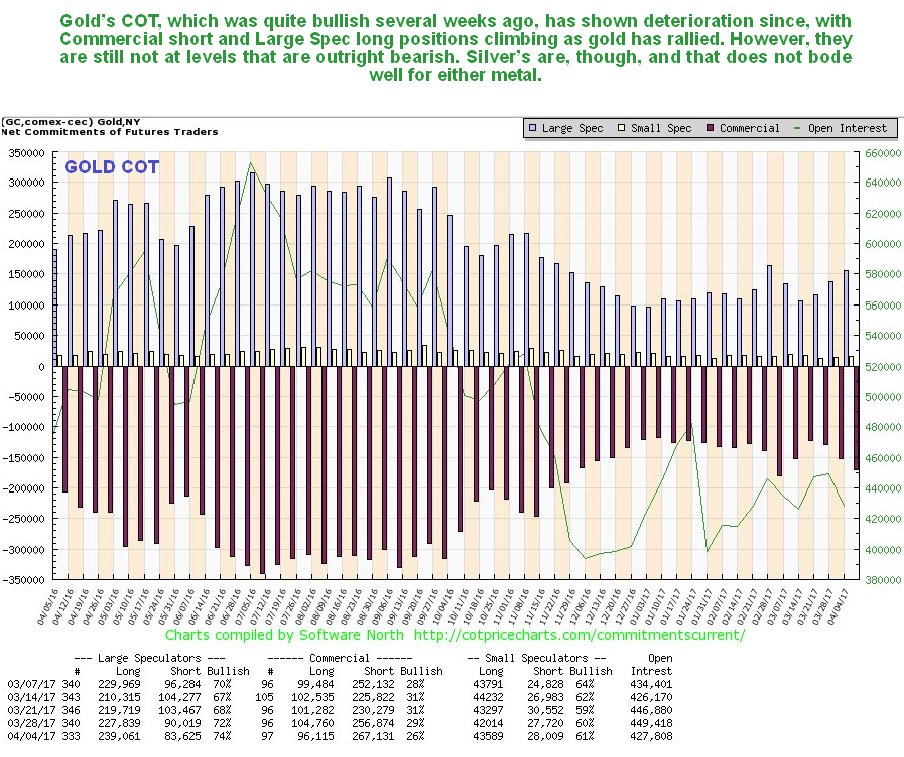
The COT picture for gold has deteriorated too in recent weeks, with Commercial short and Large Spec long positions increasing, although they are still in middling ground, and thus do not give much guidance one way or the other, unlike silver’s which are flat out bearish, and thus have negative implications for gold too.
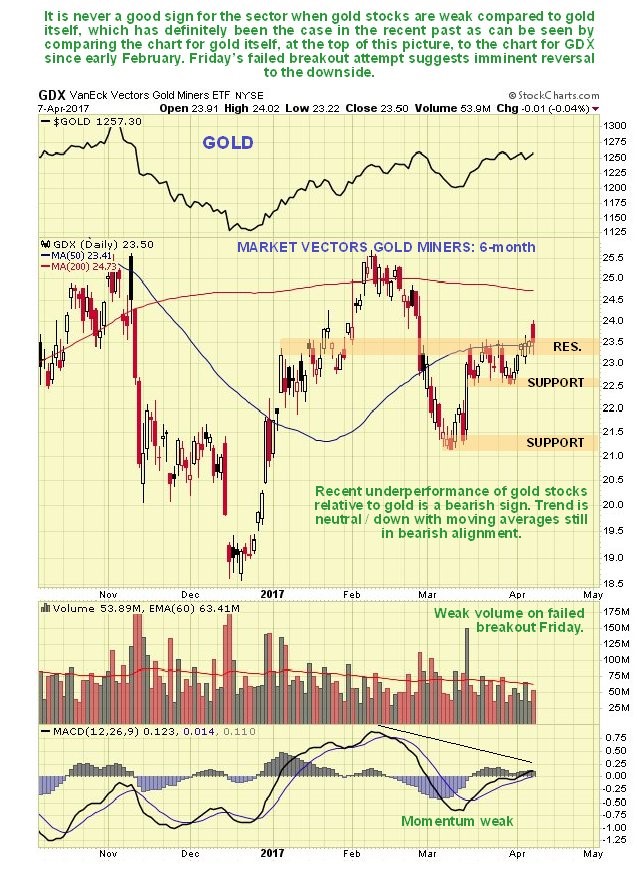
Click on chart to popup a larger clearer version. A big reason yesterday morning for excitement amongst goldbugs was gold stocks seemingly breaking out upside from their recent tight trading range, but as we can see on the latest 6-month chart for GDX, volume on this move was weak and it couldn’t hold it and the gains were completely lost by the end of the day. This action is regarded as bearish. After our successful foray into GLD Puts late in February, which we sold for a triple as gold turned up again, we will be looking at another such option trade on the site shortly.
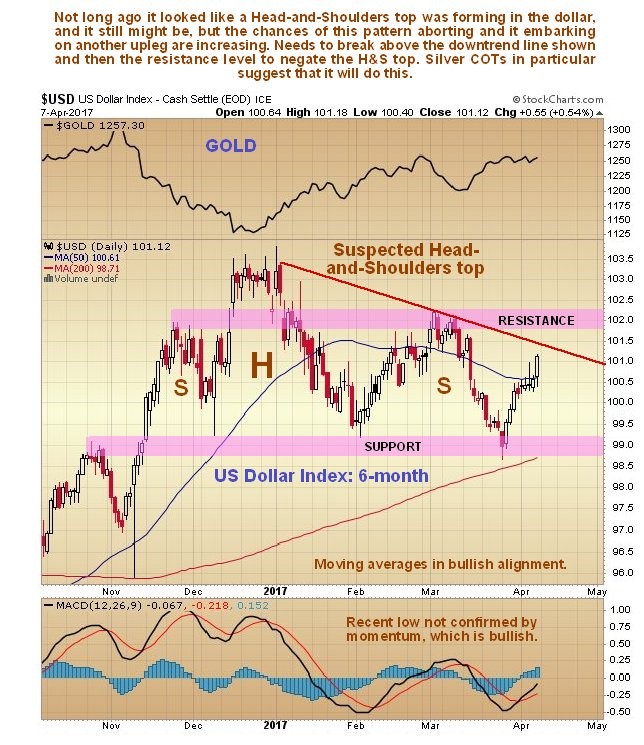
Not long ago it looked like a Head-and-Shoulders top might be completing in the dollar and the dip to the 99 area on the dollar index is what drove the modest rally in gold in late March, but it has since bounced back from this key support and it is now looking like the Head-and-Shoulders top may be aborting, an outcome suggested as likely by the now very bearish COT structure in silver. Looking at the latest 6-month chart for the dollar index, we see that key resistance levels for it to overcome in order to negate the H&S top are the red downtrend line, and then more importantly the quite strong zone of resistance in the 102 area. If it succeeds in breaking above these levels, it will have 110 in its sights.
The basic rationale of gold and silver bugs for their bullishness on the Precious Metals is that the overstretched fiat money system is set to collapse, and when this happens gold and silver, as “real money”, will take center stage. While this may be true the trick is in the timing, because the Masters of this system, who are its principal beneficiaries, clearly will much prefer to continue living lives of opulence and privilege, rather than have their heads adorning the railings of public buildings, as could happen if the system implodes and the mob go on the rampage when their “bread and circuses” life comes to a sudden stop, and are thus strongly motivated to “keep the wheels spinning” for as long as possible, and that could be considerably longer than many think.

Clive P. Maund’s interest in markets started when, as an aimless youth searching for direction in his mid-20’s, he inherited some money. Unfortunately it was not enough to live a utopian lifestyle as a playboy or retire very young. Therefore on the advice of his brother, he bought a load of British Petroleum stock, which promptly went up 20% in the space of a few weeks. Clive sold them at the top…which really fired his imagination. The prospect of being able to buy securities and sell them later at a higher price, and make money for doing little or no work was most attractive – and so the quest began, especially as he had been further stoked up by watching from the sidelines with a mixture of fascination and envy as fortunes were made in the roaring gold and silver bull market of the late 70’s.
Clive furthered his education in Technical Analysis or charting by ordering various good books from the US and by applying what he learned at work on an everyday basis. He also obtained the UK Society of Technical Analysts’ Diploma.
The years following 2005 saw the boom phase of the Gold and Silver bull market, until they peaked in late 2011. While there is ongoing debate about whether that was the final high, it is not believed to be because of the continuing global debasement of fiat currency. The bear market since 2011 is viewed as being very similar to the 2-year reaction in the mid-70’s, which was preceded by a powerful advance and was followed by a gigantic parabolic price ramp. Moreover, Precious Metals should come back into their own when the various asset bubbles elsewhere burst, which looks set to happen anytime soon.
Visit Clive at his website: CliveMaund.com


