Gold Miners’ Status Updated


After a positive year-end with the expected precious metals rally we noted on Dec. 31, in NFTRH 480:
“With HUI dwelling just under the 195 resistance parameter, a pullback can come at any time. But there are enough other factors still in line to expect a resumed rally after any grind at resistance comes into play.”
and then on Jan. 7, in NFTRH 481:
“What HUI actually did was immediately push up into the 195-200 resistance zone, become overbought and hang around there all week in consolidation. Here is the noisy daily chart once again. Let’s focus on how the most recent RSI oversold condition in December did indeed spring a tradable rally. As chartists saw the October/November shelf of support break down and then the July lows breached the call was ‘BEARISH!’ far and wide. Shorts were taken on the say so of people who know how to look laterally and see one thing lower than the other thing.
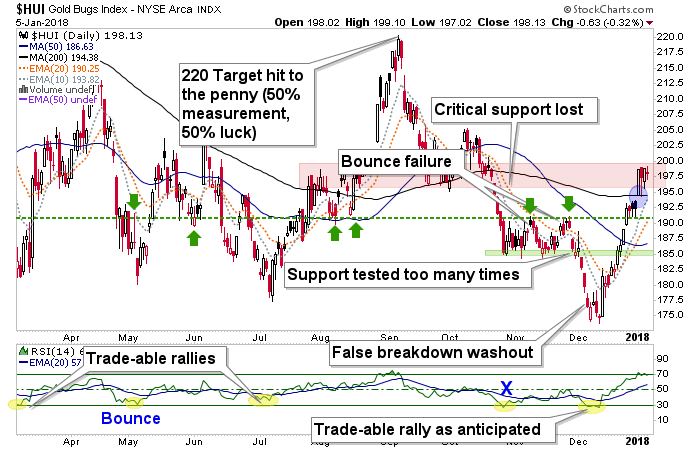
Yes, that is a swipe at charting in a vacuum. There were other things in play like sentiment, seasonals and a rapidly improving Commitments of Traders. The other thing we had going for us was a backlog of experience. Simply as a human (as opposed to a chart reader) I’d seen trap door washout whipsaws in this sector all too often. In 1st half December, the bottom was in.
While my gut says there is more rally to come, we are at the ‘bounce’ target of 195-200 and traders who do not care about scouting new bull markets or the like, should have taken profits in that zone. I simply took a few profits, but hold positions still. Huey could test the SMA 200 (black) and fill the gap (blue shaded oval above) and possibly test the green dashed support line before another leg up if another leg up is coming.”
We have been on this rally since chartists far and wide sounded the alarm on the false breakdown and whipsaw that cleaned out the sector in mid-December. See December 15’s Amid Bad Fundamentals, Gold Sector Rally May Have Begun .
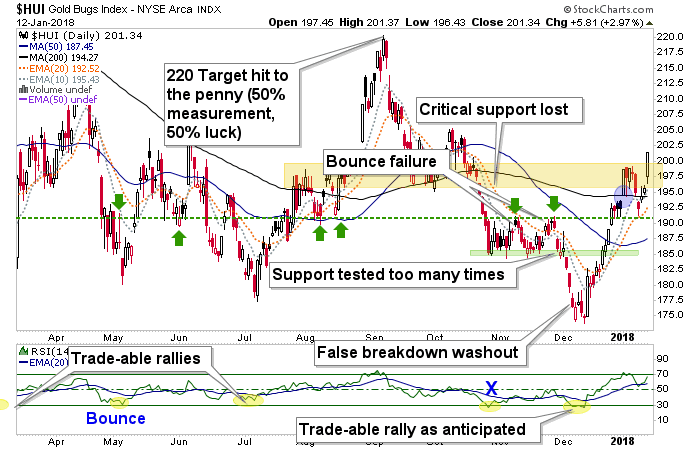
The plan had been for a pullback to shake the tree and that is exactly what we got, to the noted green dashed support line. While suggesting pure traders take profits at the initial target (195-200) I had done only very minor profit taking before the pullback and as noted in the Trade Log, was buying during and just after the hit of the dashed support line.
Of course, HUI is just a rough guide. The individual stocks I’ve bought and those reviewed in NFTRH have presented their own opportunities in their own ways. Anyway, HUI makes a good – if blunt – guide for the sector. Here is the above daily chart updated. Today confirms the view that the sector would have another leg up in January.
Let’s look at the longer-term ‘perspective’ views that we have kept at the forefront in NFTRH.
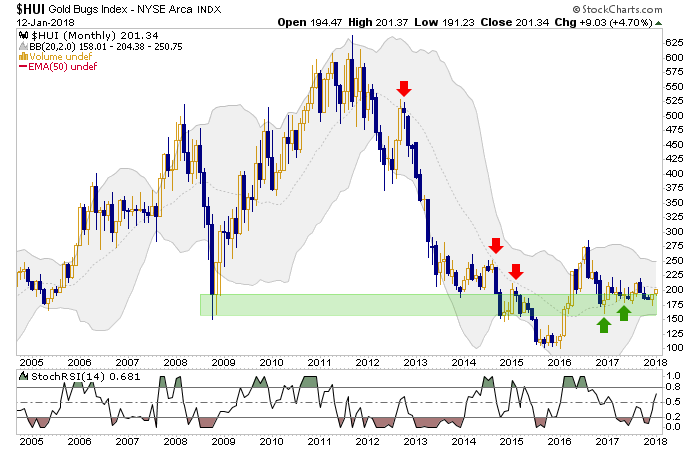
The monthly chart has for 1.5 years now been instructing that the chop and grind after the summer of 2016 is a consolidation to the impulsive leg up in the first half of that year. Everybody got aboard back then and it happened with too much force and momentum… and it happened amid badly deteriorating fundamentals! This flag or right side inverted shoulder had a job to do and that was to kill everybody’s spirits. But through the endless drudgery we have noted all along the way in NFTRH that it appears to be a bullish consolidation.
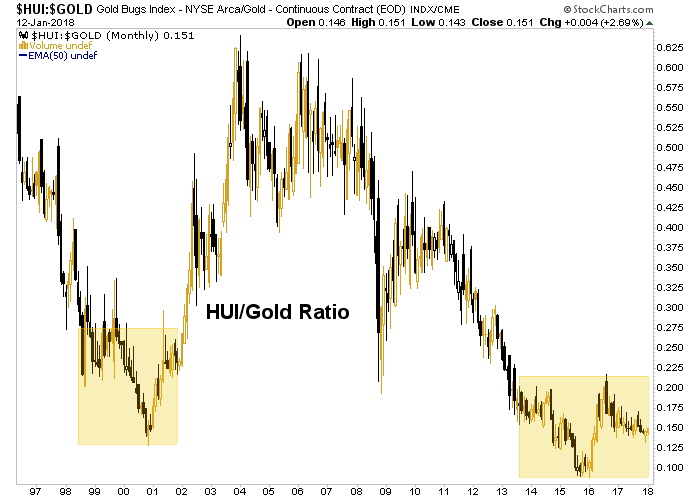
Another prospective big picture is of the HUI/Gold ratio. We have been watching this pattern form since the initial rally blew out in mid-2016 as well. Can you imagine the bludgeoning over eager and/or committed gold bugs have taken, and the frustration of overly skittish ones who got flushed in December? Meanwhile, nominal HUI and its ratio to gold simply lumber on. Markets move slower than our hyper kinetic brains and they don’t care what we think we know on any given daily or weekly basis (aided by the media’s hysterical inputs, no less).
Ah, but all of the above are just charts. The whole reason we did not get shaken out of the rally is because there are other short-term factors involved. Those were seasonal, sentiment and CoT related. As for the most important aspect, the macro fundamentals, a quick look at some gold ratio charts in my list tells me that things are improving there. But due to the big macro party the improvement is not yet substantial. We’ll update the sector view in NFTRH 482 along with quality miners and explorers.
For now, the precious metals are rising with the ‘inflation trade’. When the hysterics fade and inflation traders are one day sent to walk the plank then it will be time for the real distinct bull market in the PMs, probably after a flush of some degree with said inflation trade.* There is a rhythm in play and the majority will not dance to it.
Meanwhile, Gary parties on with the rest of ’em.
* It is tradition in the gold sector; the periodic running of the inflationist gold bugs.
Subscribe to NFTRH Premium for an in-depth weekly market report, interim updates and NFTRH+ chart and trade ideas; or the free eLetter for an introduction to our work. You can also keep up to date with plenty of actionable public content at NFTRH.com by using the email form on the right sidebar. Or follow via Twitter @BiiwiiNFTRH, StockTwits or RSS. Also check out the quality market writers at Biiwii.com.


