Gold Price $2,150 Or Bust


My projection for gold a few weeks back to $2,150 is still not in any jeopardy of failure. There will be bumps along the way such as Friday’s decline, but these by themselves are not anything to worry about. So, when do we arrive at that price? Unfortunately my primary method of trying to gauge a price projection does not provide any time scale. Timing for such move is more determined by external events such as war and the like. It might also take a Clinton victory -- and all the debt that will follow to raise gold to unheard of heights. Who knows what event will precipitate a gold boom.
The chart this week should alleviate any immediate fears of a meltdown. However, there are starting to be some signs that an upward surge may still be some distance ahead and rough riding for the near future.
LONG-TERM
Ever since very early February when the long term momentum indicator moved into its positive zone and the gold price moved above its positive sloping long term moving average line the long-term has remained positive. There is still nothing in the long-term charts to cause any worry from this time perspective. The long-term remains BULLISH.
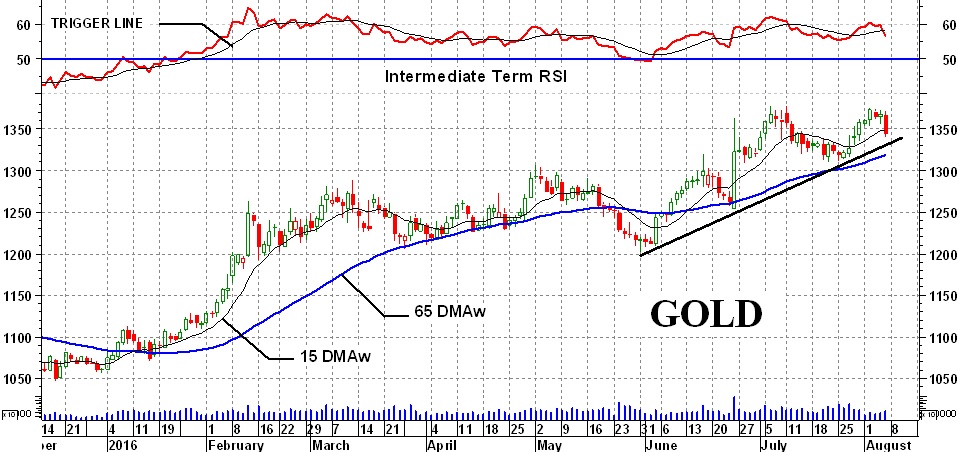
INTERMEDIATE-TERM
Let’s get the basics over with first. The gold price remains above its positive sloping intermediate term moving average line with the momentum indicator still in its positive zone. The only cautionary indicator here is the momentum trigger line. The momentum has just crossed below its trigger line for an initial mild indication of caution. Nothing yet to worry about but to keep an eye on further progress. For now the intermediate-term is still rated as BULLISH.
Apart from the basics there is that negative divergence in the momentum indicator versus the price action. We saw the negative divergence in the momentum when the price made a new high in March and then again in May. In early July as the price made new highs the momentum was once more underperforming versus its previous high mark although it did exceed its previous high in May. These negative divergences are not something that would cause one to immediately go out and sell everything but they are initial warnings that the strength of the underlying price trend is not what it might seem to be.
There is more here in the intermediate-term indicators but they are not immediately critical so I’ll leave them for another time.
SHORT-TERM
The short-term is in more immediate danger of a trend reversal. The price has just crossed very slightly below its short term moving average line although the line is still in a slight upward slope. The short-term momentum indicator is still in its positive zone but sitting almost right on top of its neutral line. It has dropped below its trigger line and line has reversed its slope to the down side. Putting all this together I get a short-term rating of – NEUTRAL, the rating just short of a full bear rating.
There are a few short-term indicators that are still positive (for now). The price remains above short-term support at the $1310 level and above its short/intermediate-term up trend line (shown). In addition, the short-term momentum indicator had dropped just below its neutral line a couple of times in the very recent past with the price turning upward at that point. We could be very close to that happening again but I don’t trust history repeating itself too often before it disappoints.
GOLD STOCKS
Gold and most major North American Gold Indices closed slightly lower during this past week. Only the NYSE Arca Gold BUGS Index (HUI) closed higher and only by about ½ of 1%. On the other hand the Merv’s Penny Arcade 50 Index closed the week higher by a comfortable 6.6%. It is now up some 418% above its Dec low. This starts to become a worry. One cannot expect stocks to keep rising in almost a steady fashion for months on end without a serious reaction or at least a significant rest period. Since the start of this “penny” market bull in December the Index has closed lower only 4 times and then only to a very, very insignificant amount. Who knows, this bull-run in the “pennies” may still continue for a while but the prudent speculator would do well to watch these speculations very closely.
On the other hand, looking at this Index and the previous major bull-run, the Merv’s Penny Arcade 50 Index gained 539% from late 2008 to mid 2009. After a short rest period the Index continued its bull run to top out in early 2011 with a gain of 2141%. Let’s hope history does repeat.
As an extra caution in the “penny” sector, both the intermediate and long term momentum indicators for the Index are way, way inside their overbought zones and are trending laterally, ready to decline.

Readers are invited to view my Facebook page at https://facebook.com/merv.burak where I will be slowly posting commentaries explaining in more detail my various indicators and techniques. I also present from time to time some individual stocks that look as if they may be good speculations. However, nothing I post is meant to be a recommendation to buy or sell. One should check with their broker or investment advisor before acting.
 Merv is a retired Aerospace Engineering consultant. He is also a retired market technician with over 40 years of market experience and research. Merv received his certification as a Chartered Market Technician (CMT) in 1992. Developer of many technical techniques and programs which he has been using in his previous Technically Speaking with Wil-Arm and Technically Precious with Merv commentaries posted throughout the globe. Developer of several gold and silver Indices, Merv continues to update his Merv’s Gold & Silver 100 Index and Merv’s Penny Arcade 50 Index and reviews them during his periodic on-going Technically Precious commentaries.


