Gold Price Around US Presidential Elections


In previous articles, we examined gold's performance in the presidential election cycles. The only relatively reliable conclusion we were able to draw from the long-term analysis is that the post-election year is the worst for the price of gold in the whole cycle. Let's now focus on gold's short-term dynamics around election time.
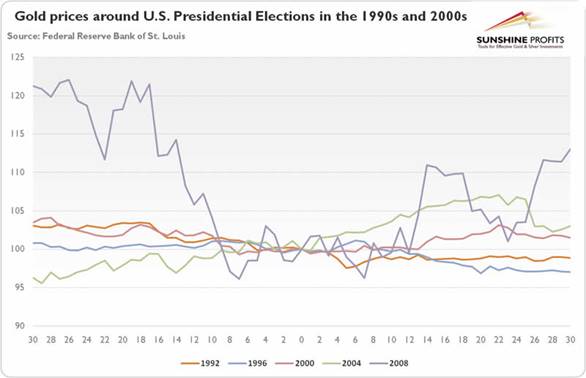
The two charts below show the dynamics of gold prices thirty trading days before Election Day and thirty days after.
Chart 1: Gold prices thirty trading days before and after U.S. Presidential Elections in the 1970s and 1980s (index; the price of gold from the Election Day = 100).
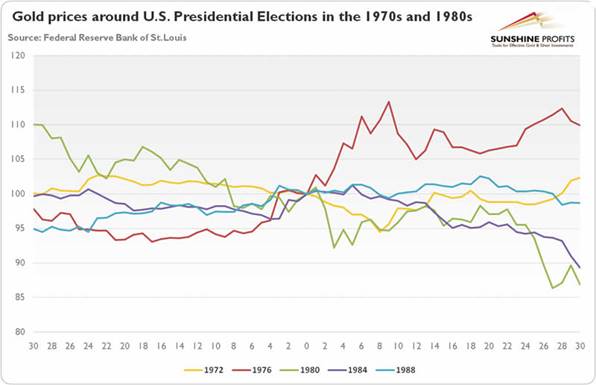
Chart 2: Gold prices thirty trading days before and after U.S. Presidential Elections in the 1990s and 2000s (index; the price of gold from the Election Day = 100).
Again, no clear pattern emerges. For example, after the elections in 1972 gold continued for a week its downward trend which started a few weeks before, reaching a bottom before it rallied later. On the other hand, in 1976 the yellow metal continued its upward trend and jumped 2.73 percent the day after elections. It seems that elections do not significantly move the gold market, at least over two-month spans. But what if we extend or shorten the periods?
The next chart shows returns of gold in four periods of thirty days around the U.S. presidential elections (they are scheduled for Tuesday after the first Monday of November, therefore we decided to analyze four thirty day periods rather than calendar months) between 1972 and 2012.
Chart 3: The monthly returns of gold (London P.M. Fix) in the four months around U.S. presidential elections between 1972 and 2012.
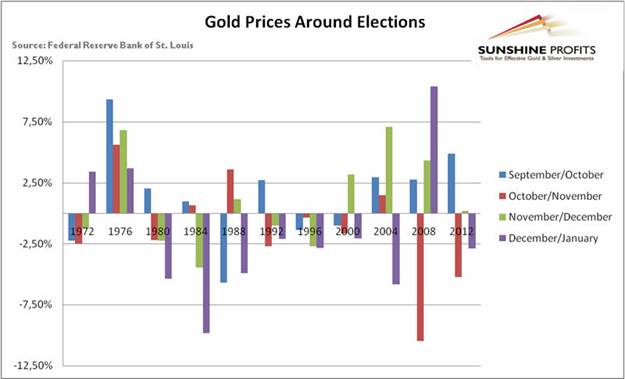
You can clearly see a certain pattern now. Historically, gold gained the most in September/October period and performed the worst in December/January period over the presidential election cycle. It is in line with the widely known fact that September is one of the best months to own gold (gold's seasonality). The data also shows that, on average, the price of gold falls (-1.25 percent) in October/November, but rebounds in November/December (1.01 percent), just to decrease (-1.66) again in December/January. This pattern was clearly seen in the last U.S. presidential elections. Let's look at the gold chart below.
Chart 4: The price of gold at the time of the 2012 U.S. Presidential Election.
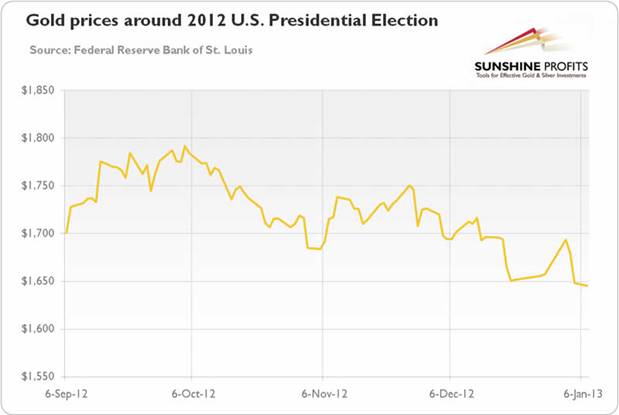
The price of gold increased in September but started to decline around one month before the elections. Interestingly, the shiny metal rebounded just after November 6, exactly on the Election Day. However, after three weeks the price of gold returned to its downward trend. Without a detailed study, it is hard to say anything with certainty, but such behavior may be attributable to the elections.
The next chart presents the comparison between the average monthly returns of gold in November in election and non-election years. In 1971-2015 period, gold lost in election years 0.04 percent, on average, during that month, while gaining only 0.07 in non-election years and 0.04 percent overall.
Chart 5: The monthly average returns of gold in Novembers overall, in election years and non-election years since 1971.
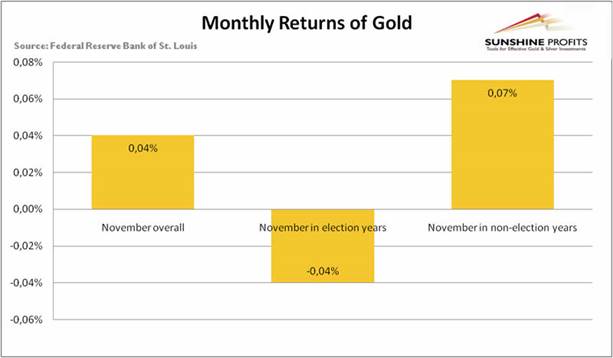
This behavior would suggest that elections are detrimental for the price of gold if not for one small thing: gold was stronger in non-election years in 9 of 12 calendar months. For the sake of clarity, we limited the graphical presentation of such behavior to crucial months around election time (see the Chart 6). Therefore, it is hard to conclude from this data that the U.S. presidential elections significantly affect the gold market - it may be that non-election years were just generally more bullish for the gold market.
Chart 6: The monthly average returns of gold in September, October, November, December and January overall (blue columns), in election years (red columns) and non-election years (green columns) in 1971-2015.

Let's now focus on the very short-term gold response to U.S. presidential elections. As one can see in the chart below, there is no clear trend, as the price of gold increased six times the next day after election and decreased five times, with the average response of a 0.56 percent jump.
Chart 7: The daily returns of gold the next day after the U.S. Presidential Elections from 1972 to 2012.
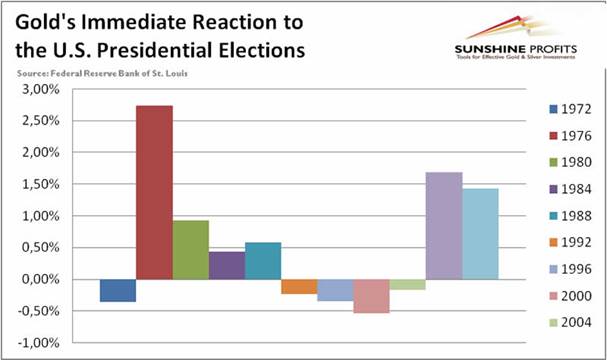
The strongest reaction occurred after Carter victory and both of Obama's. This may be attributed to some worries about their fiscal policies, but it may also be the case that gold reacted more positively during bull markets. The Carter example is instructive as he was considered an outsider distant from Washington, D.C. just like Donald Trump. Therefore, if Trump wins, the price of gold may rise in the short-term. However, we must conclude that our extensive analysis suggests that, in the long-term, the yellow metal is affected by the U.S. economy and monetary policy rather than the U.S. presidential elections.
********
If you enjoyed the above analysis and would you like to know more about the gold ETFs and their impact on gold price, we invite you to read the April Market Overview report. If you're interested in the detailed price analysis and price projections with targets, we invite you to sign up for our Gold & Silver Trading Alerts . If you're not ready to subscribe at this time, we invite you to sign up for our gold newsletter and stay up-to-date with our latest free articles. It's free and you can unsubscribe anytime.
Arkadiusz Sieron
Sunshine Profits‘ Market Overview Editor
Disclaimer
All essays, research, and information found above represent analyses and opinions of Przemyslaw Radomski, CFA and Sunshine Profits' associates only. As such, it may prove wrong and be a subject to change without notice. Opinions and analyses were based on data available to authors of respective essays at the time of writing. Although the information provided above is based on careful research and sources that are believed to be accurate, Przemyslaw Radomski, CFA and his associates do not guarantee the accuracy or thoroughness of the data or information reported. The opinions published above are neither an offer nor a recommendation to purchase or sell any securities. Mr. Radomski is not a Registered Securities Advisor. By reading Przemyslaw Radomski's, CFA reports you fully agree that he will not be held responsible or liable for any decisions you make regarding any information provided in these reports. Investing, trading, and speculation in any financial markets may involve high risk of loss. Przemyslaw Radomski, CFA, Sunshine Profits' employees and affiliates as well as members of their families may have a short or long position in any securities, including those mentioned in any of the reports or essays, and may make additional purchases and/or sales of those securities without notice.

Arkadiusz Sieroń received his Ph.D. in economics in 2016 (his doctoral thesis was about Cantillon effects), and has been an assistant professor at the Institute of Economic Sciences at the University of Wrocław since 2017. He is a board member of the Polish Mises Institute of Economic Education, author of several dozen scientific publications (including in such periodicals as the Journal of Risk Research, Prague Economic Papers, Quarterly Journal of Austrian Economics, and Research in Economics), and a regular contributor to GoldPriceForecast.com and SilverPriceForecast.com. His two books, Money, Inflation and Business Cycles and Monetary Policy after the Great Recession, are both published by Routledge. Arkadiusz is also a certified Investment Adviser, a long-time precious metals market enthusiast, and a free market advocate who believes in the power of peaceful and voluntary cooperation of people.


