Gold Price Forecast: $1,885 the Key Test for 2024 – 2025


Following Wednesday’s Federal Reserve meeting, the gold market is at a make-or-break moment: if key support at $1,885 can hold over the coming weeks, gold should be set to break to new all-time highs later this year or early 2024. However, if this key support fails, gold will likely not be breaking out until 2025 in the best case scenario. In a worst case scenario, a failure at $1,885 would imply that a long-term top is already in place for the sector.
Following a long-term top, years or even decades of lower gold prices would manifest. It is thus imperative for investors to follow these significant trends that are now being tested.
Let us examine the key support areas to define these tests in the gold market.
Defining Gold’s Key Support
Gold’s key support is a 5-year linear rising trend of buyers which began to emerge out of the August 2018 lows (blue):
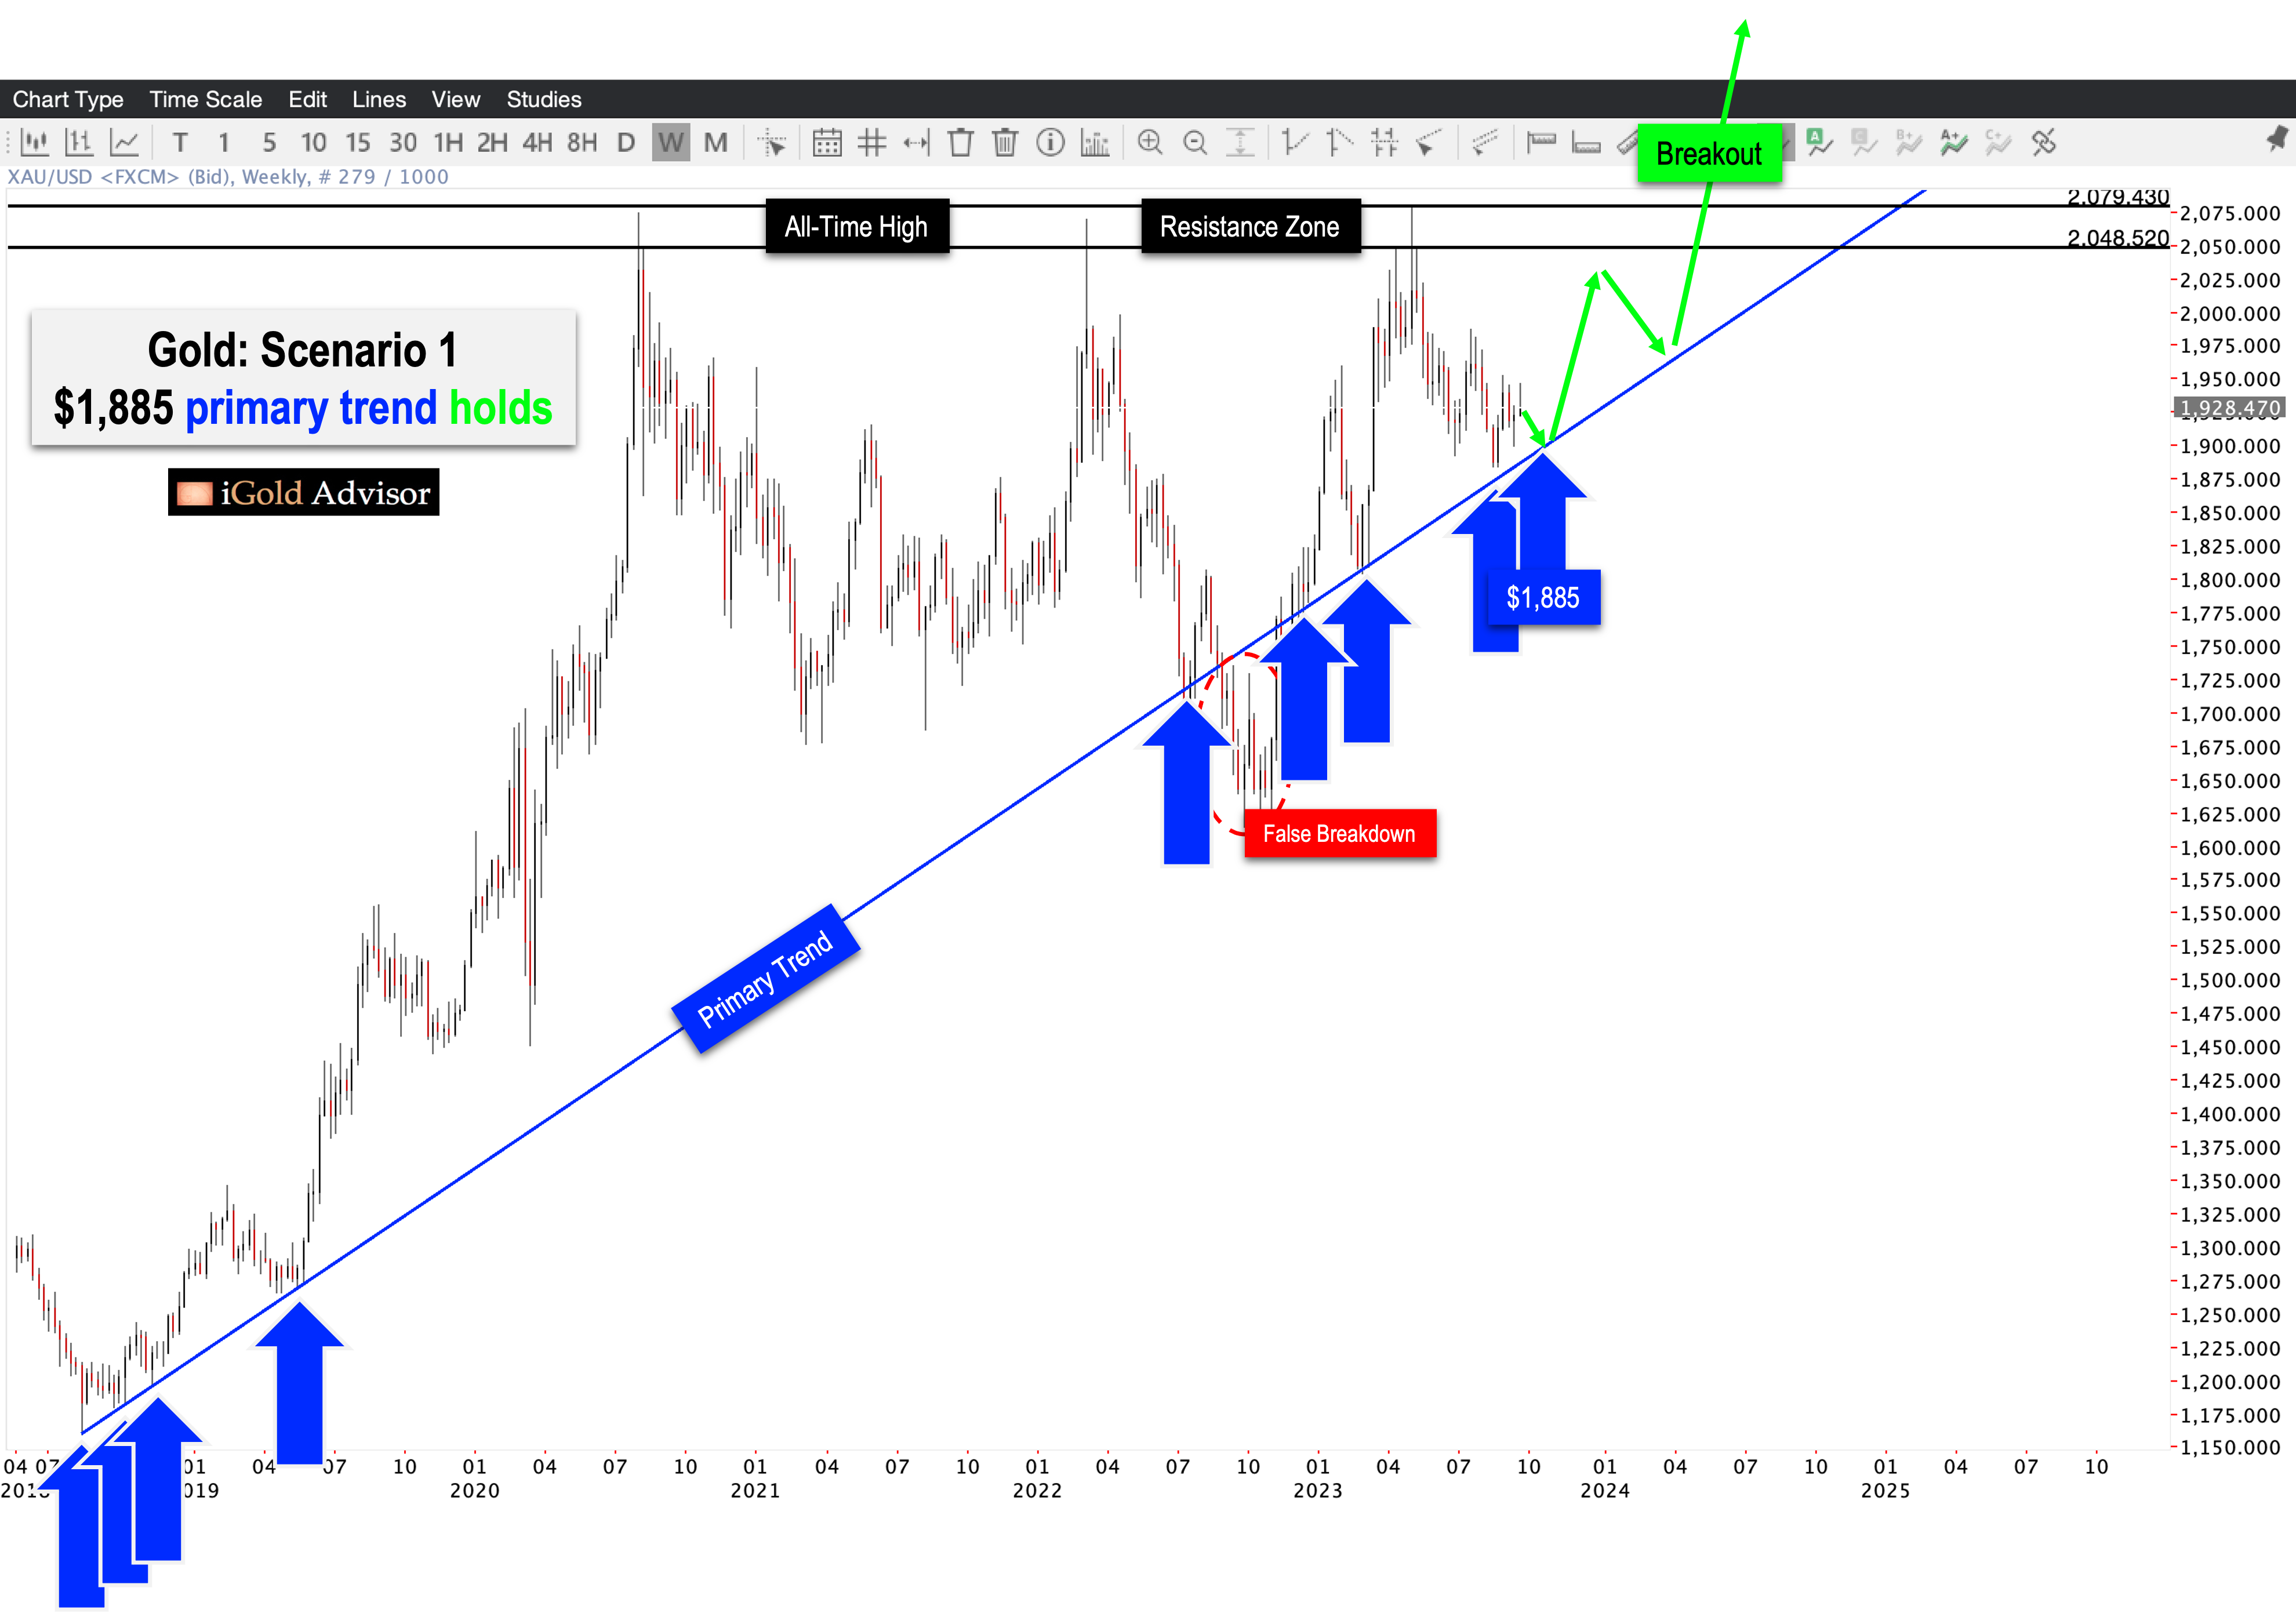
Since 2018, on no less than 8 occasions (blue arrows), each time gold has touched this rising trend, buyers have emerged to propel the precious metal higher. [Note the one false breakdown in 2022 (red). Upon recovery, the primary trend (blue) acted as support again on 3 additional occasions, reestablishing its legitimacy.]
Whatever their reasons – concerns over depreciating fiat currencies, rising debt levels worldwide, or the war in Ukraine – gold buyers have emerged at higher and higher intervals at regular occasions since 2018.
The key primary rising trend (blue) today comes in at $1,885. Gold is currently trading at $1,930 in the spot market as this article is being written. Thus, only $45 buffer room exists before this trend is tested again.
Ramifications of a Successful Trend Test
As a technical analyst, I place foremost concern that this trend holds.
Should gold prove successful at remaining above the rising key support (blue) at $1,885 on weekly closes going forward, it will set the market up for a continuation move higher that should feature a breakout above the all-time high resistance zone (black). According to the visible evidence, this breakout would occur by mid-2024 at the latest.
Beyond that breakout, gold would be in “blue sky” territory, where there will be no pre-established resistance levels, and so it would be possible for gold to rise by hundreds of dollars further in a short period of time.
Ramifications of a Failed Trend Test
However, should buyers not show up at the primary trend of $1,885, or dedicated sellers shove the price below this key figure on dual weekly closes, the ramifications for the gold price will be significant.
Note the two possibilities (a) and (b) following the primary trend break scenario, as shown below in red:
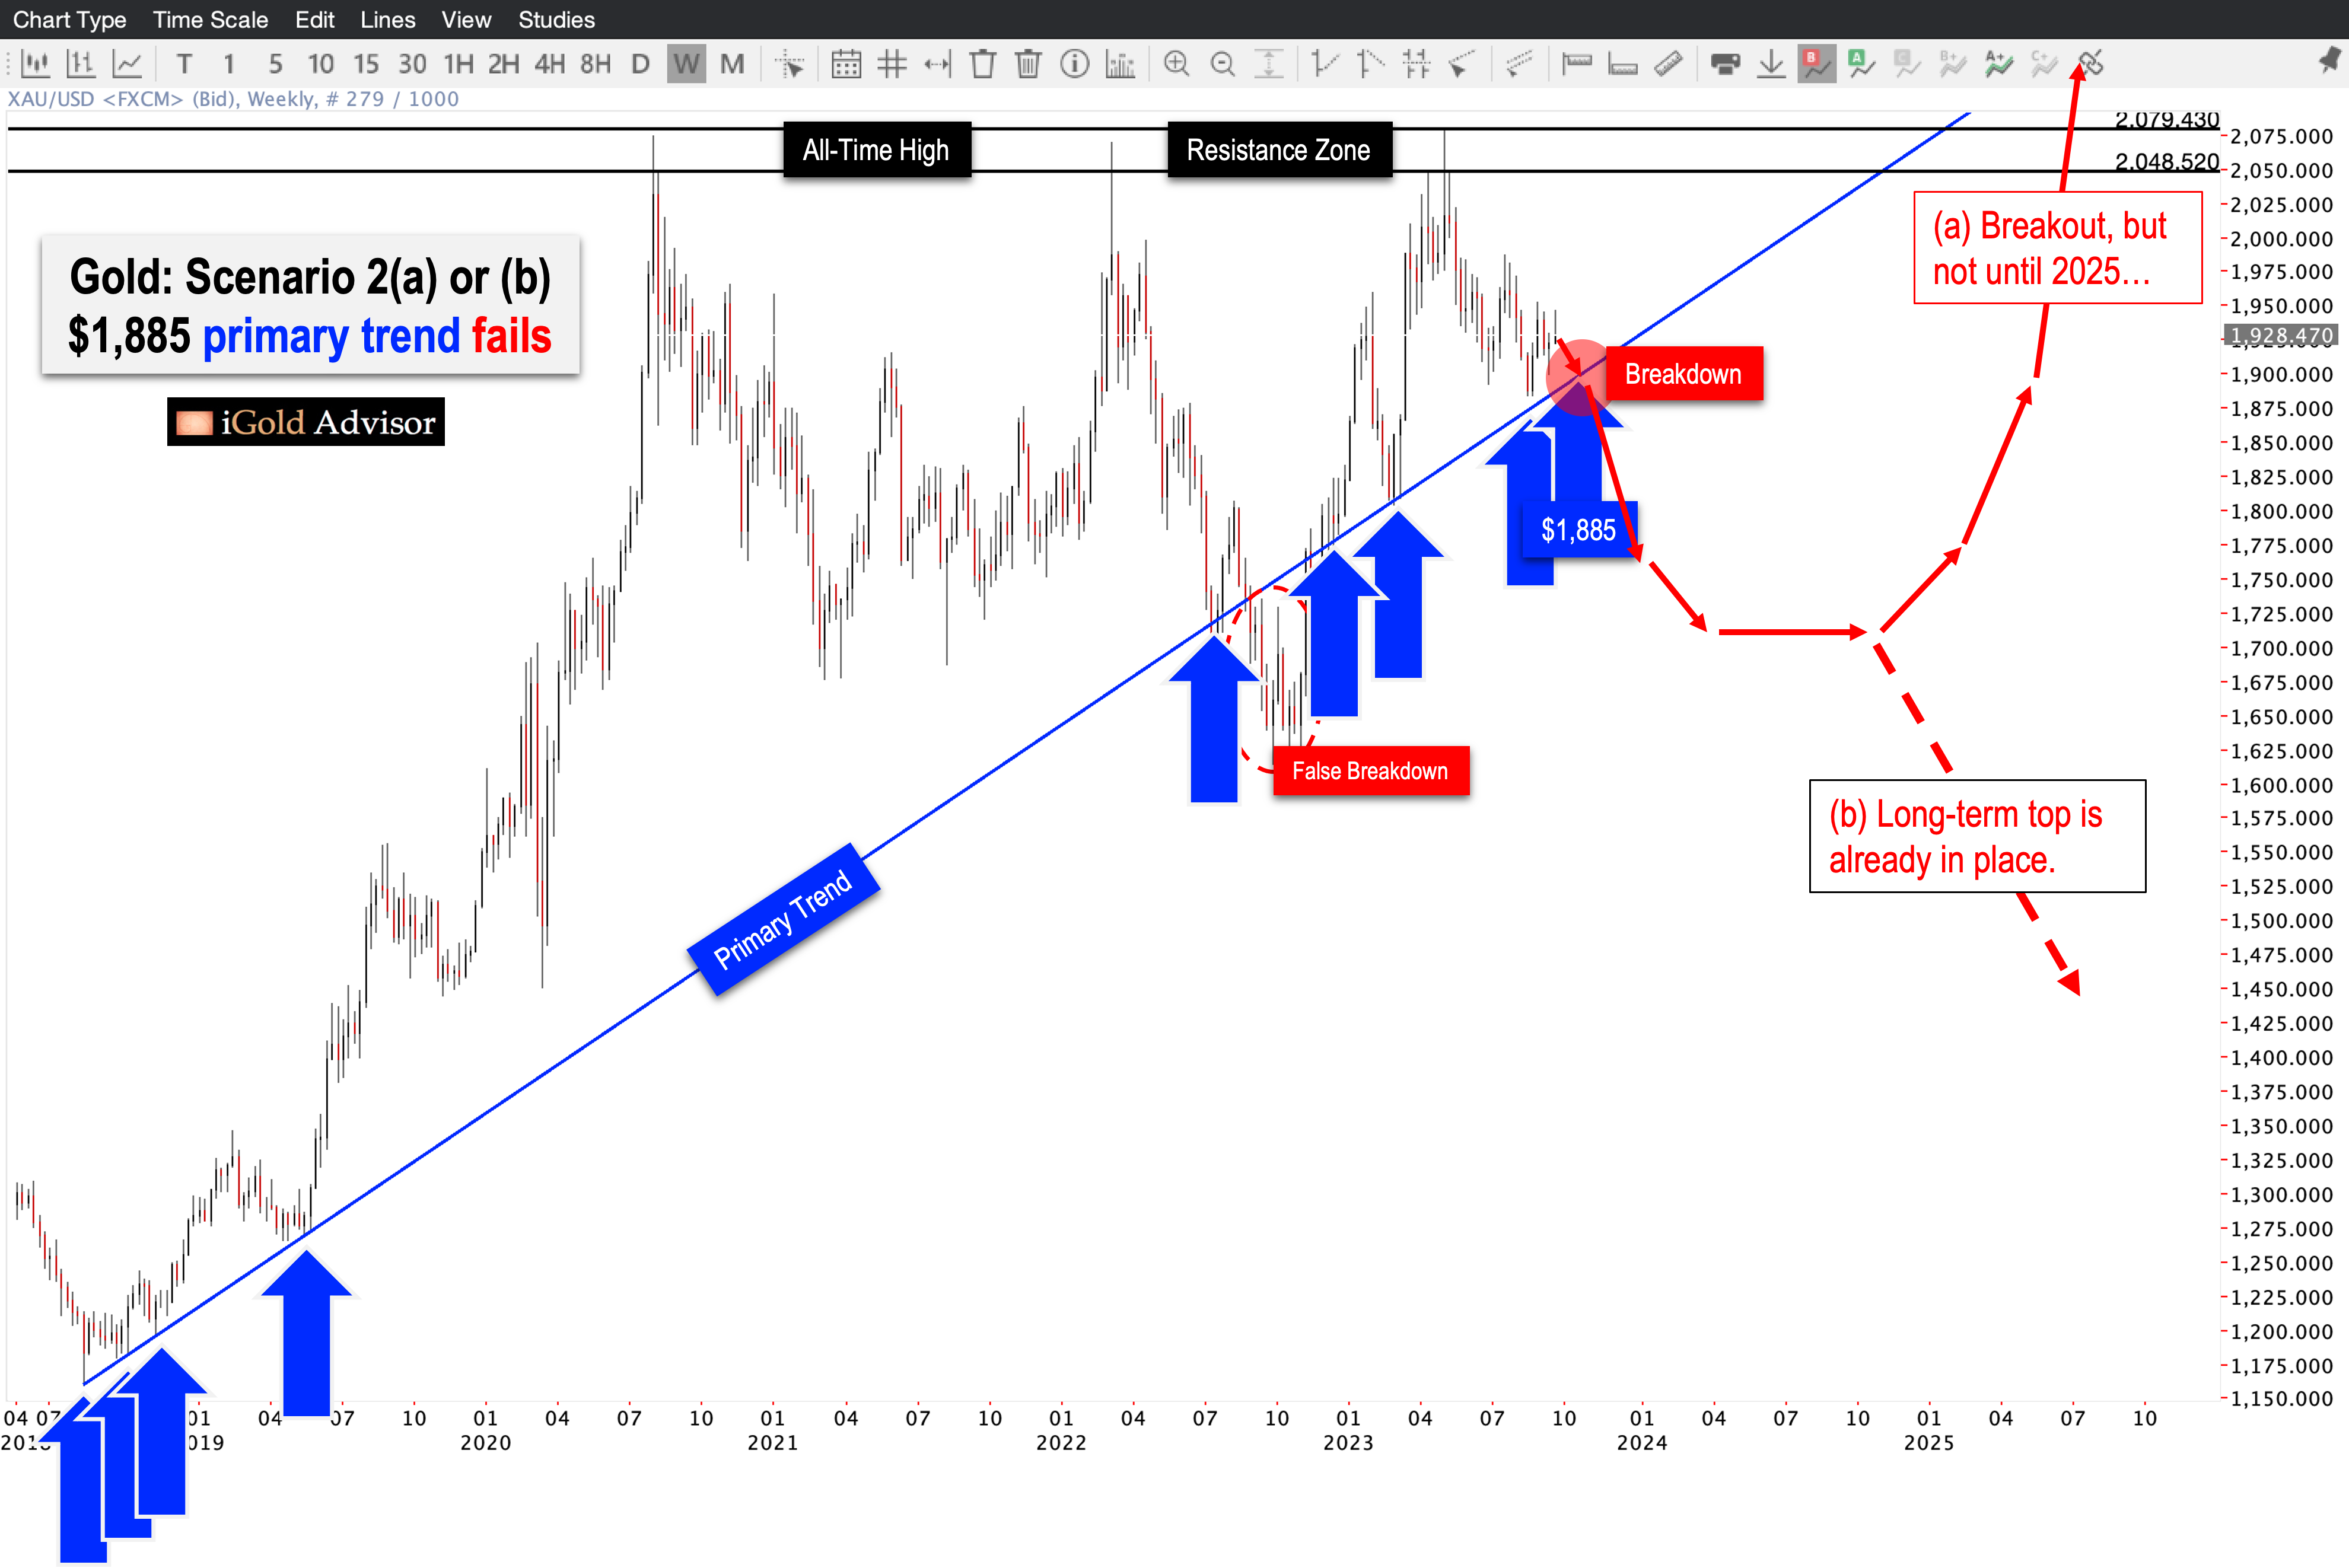
Scenario (a) – Upon a break below primary support, gold would be expected to fall back toward the next significant support zone, matching 2020 and 2021 bottoms circa $1,680 per ounce. From there, should buyers emerge again as they have in the past, it would still be possible for gold to break out to new all-time highs – however, this would not happen until well into 2025 at the earliest, according to the chart.
The reason for this delay is that, in this such a breakdown scenario, sellers would be expected to show up on the now-broken former primary trend (blue). The rule in technical analysis is “broken support turns to resistance” for exactly this reason. Thus, in order to break out, gold would have to clear sufficient distance away from the broken trend, in order to advance to potential new all-time highs on the opposite side of the trend.
This could not occur until 2025 at the earliest.
Scenario (b) – The much worse alternative following a primary trend break is that gold would continue to deteriorate through 2024 and 2025, buyers would fail to emerge at the former support level near $1,680, and thus gold would form a long-term top.
Such a long-term top could last for many years or decades. Such is the lesson from previous long-term tops in gold, as in 1980 at $850 per ounce, a figure which was not eclipsed for 28 further years, or the 2011 long-term top in gold, a figure which was not eclipsed for 9 more years.
Long-term tops in precious metals tend to be multi-year to multi-decade affairs. If one is bullish on precious metals, one does not want a potential long-term top chart pattern to emerge. If gold breaks its primary rising trend at $1,885 over the coming weeks, such a long-term top pattern would have a 50% probability of developing.
Takeaway on Gold Prices
Gold prices have been in a clear rising trend since 2018. No matter their reasons (inflation, debt, war), buyers have continued to emerge at higher and higher intervals throughout time. Currently, the trend of higher buyers comes in at $1,885, a figure just $45 below the current market price as this article is being written.
As a technical analyst, I want to see a clear multi-year primary rising trend hold.
Should this primary trend fail, it would open up two remaining possibilities on the chart:
- a continued decline and consolidation, followed by a successful breakout, but not until 2025 at the earliest.
- a long-term top pattern, followed by years or decades of declining precious metals prices.
At www.iGoldAdvisor.com, we are monitoring these and other critical market trends on a daily basis for premium subscribers and consultation clients via video updates and flash notices. Our clients will be the first to know when key trends break, what the ramifications are, and how to best protect oneself from a potential gold market decline.
If one is bullish on gold prices, one does not want to see $1,885 fail, because by implication, the possibility of a long-term top to form will have become much greater.
********

Christopher Aaron began his career as an intelligence analyst for the CIA and Department of Defense. He served two tours to Afghanistan and Iraq between 2006 - 2009, conducting pattern-of-life mapping for military leaders.
Mapping shares similarities with technical analysis of the financial markets because both involve the interpretation of repeating patterns found in human nature. He is the founder of iGold Advisor, providing independent research and analytics on all aspects of the precious metals markets.
He speaks regularly on the cyclical patterns found within the financial markets and on international policy. He has been featured in the New York Times and NPR news amongst other financial publications.


