Gold Price Is Going Higher Whether Or Not FED Tapers


The Federal Reserve is in a very tough position. Despite unprecedented amounts of stimulus, GDP growth is anemic, unemployment remains historically high, durable goods orders have plunged and rising rates are harming the housing rebound. If this is all that can be accomplished with record low rates and trillions in quantitative easing, the underlying health of the economy must be magnitudes worse than believed.
Most analysts are expecting the FED to taper in September, significantly reducing their $85 billion per month in asset purchases. While it is easy to throw around dollar amounts such as $85 billion, we should put this number into context. $85 billion per month is over $1 trillion per year and is equivalent to over 20 million new jobs paying $50,000 per year. It is enough to end world hunger 30 times over or send every high school student to a four-year college.
Yet, despite spending this unfathomable amount of money on quantitative easing, the economy only grew at 1.7% during the second quarter. Can you imagine the condition of the economy today if the FED was not buying $85 billion in bonds per month?
Interest rates would skyrocket, the stock market would collapse, the housing market would collapse, credit markets would freeze up, unemployment would skyrocket and foreign nations would very well accelerate their dumping of U.S. debt.
Sound dramatic? I am not the only one that holds such views. The Federal Reserve essentially hoisted a trial balloon earlier this year by discussing the possibility of tapering. What transpired was an immediate and severe sell-off in the stock market at only the hint of the possibility of future tapering. Imagine the impact when the FED actually confirms the beginning of tapering?
Employment Data Suggests More QE is Needed, Not Less
The FED has a dual mandate of maximum employment and price stability. They have discussed not tapering until official unemployment drops to 6.5%, but it still remains at 7.4%. And even this historically high number of 7.4% does not paint the total picture of the employment situation in the United States.
The better measure of unemployment, U6, is hovering around 14%. If we use a more honest measurement, such as the one calculated by Shadowstats to include long-term discouraged workers that conveniently get defined out of existence in government models, unemployment is at an all-time high around 23%!
Another good way to get an accurate understanding of the health of the jobs market is to look at the civilian employment-population ratio. In very simple terms, it tells us what percent of working-age Americans have a job. It was roughly 65% in 2000 and following the bursting of the dotcom bubble in 2001, the ratio dropped to 62%. When the 2008 financial crisis hit and the recession took hold (grey area), the rate dropped sharply from 63% to below 59%. This drop was nearly twice as severe as the one that followed the 2001 dotcom recession. But here is the real kicker… the employment-population ratio has remained below 59% for 4 years now and has failed to recover at all, following the 2008/2009 recession.
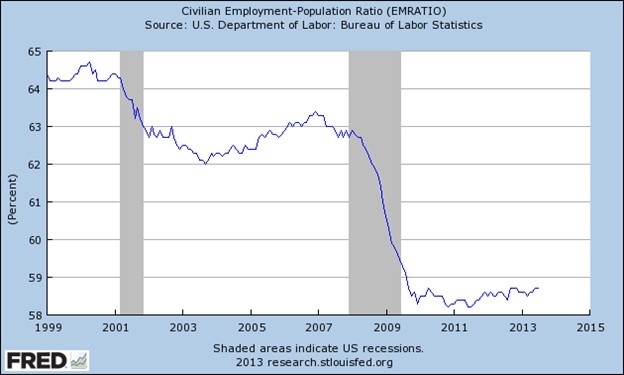
This is the first time in modern history that there hasn’t been a strong bounce back in the employment market following a recession and it is an ominous sign for the future. Simply put, there has been no real recovery in the labor market.
Official Measures of Inflation Remain at Historically Low Levels
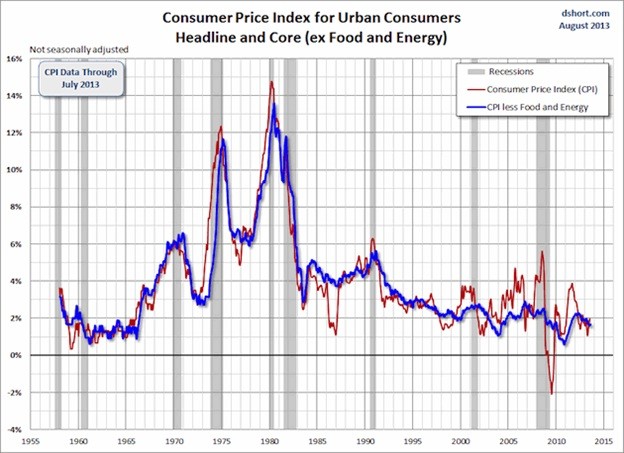
While you may not feel it when shopping for groceries, pumping gas or buying health insurance, official indicators are showing that both headline and core CPI remain below 2%. This is not the type of inflation that would compel the FED and policymakers to back off stimulus programs. In fact, this level of inflation is technically lower than desired, suggesting that there is room to increase stimulus efforts without causing runaway inflation.
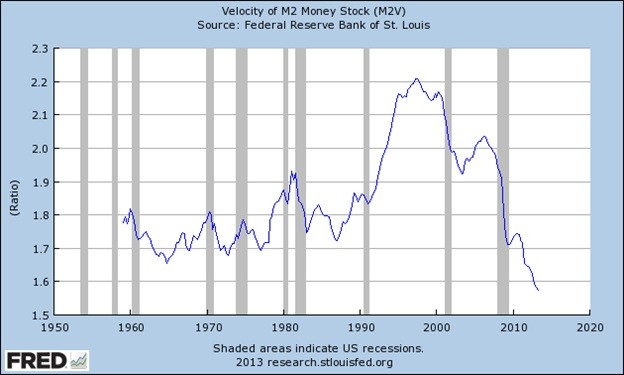
This is contrary to what many gold investors had expected following the trillions in bailouts and money printing in 2009. The main reason all of this new money has not yet translated into high inflation has to do with the velocity of money. This term is used to describe the pace at which money is circulating through the economy and being used to buy goods and services.
The chart below shows that the velocity of money has fallen to the lowest level ever on record. It went into free fall during the latest recession and has continued dropping towards the 1.5 level.
So, with both of the FED’s mandates pointing towards the need for more quantitative easing and not less, why are so many investors and analysts convinced that the FED will begin tapering next month?
Perhaps it is because of the subtle hints or perhaps this what the central bankers want investors to believe… the story of an improving economy that no longer needs stimulus. Of course, this notion is so far removed from the truth, but it is a delicate balancing act needed to keep the house of cards from collapsing.
My analysis of the situation suggests the exact opposite. I believe there is no chance of tapering in September and very little chance of tapering by year end.
What are the Implications for Gold Investors?
It seems that the recent bloodbath in the precious metals market was driven largely by this belief of an end or significant tapering to FED bond buying. This forecast was gradually baked into gold and silver prices, leading them to fall to multi-year lows amidst the worst correction of the entire 12-year bull market. But was the sell-off justified?
Recent action suggests it was severely overdone and if you want to see some real fireworks in precious metals, wait until the FED concludes their September meeting without any announcement of tapering. Even more explosive would be the news that the FED plans to increase their quantitative easing efforts in order to push rates back down, spur hiring in the job market and lift inflation measures to more desirable levels.
But even if the FED does decide to taper, it will only be a token amount aimed at pleasing opponents of the program and those rightfully concerned about the expanding balance sheet and deepening debt levels. Would the FED buying $70 billion per month instead of $85 billion per month be cause to turn bearish on precious metals or equities in general?
Some may even view such a move as proof of a strengthening economy and increasing velocity of money. In such conditions, inflation indicators are likely to spike higher and spread fear that all of the money printed in the past 5 years will finally begin flowing into the markets. This would be bullish for precious metals and commodities overall.
Summary and Conclusion
I believe that investors have incorrectly assumed the FED will announce significant tapering in September. This concern has spread through the markets over the past several months and is now baked into gold prices. However, if my hypothesis is correct and the FED does not taper in September as expected, look for a continued upward revision to gold and silver prices. In the short term, this upward trajectory will likely be accelerated by increasing tensions in the Middle East and the potential of a new war with Syria.
While I advocate holding physical metals in your possession first and foremost, the value currently being offered by mining stocks is hard to ignore. If mining equities continue their recent leveraged performance to the underlying metals, we will see some very explosive moves in quality companies with high grades and low costs. They will benefit not only from higher gold prices and recent programs to reduce cash costs, but from a newfound bullishness in equities overall following the realization that the FED will not be taking away the easy-money punch bowl anytime soon.
After an uneventful and sometimes painful two years for precious metals investors, there is now very little downside risk and huge upside potential. A return to previous highs would mean a 35% gain for gold, 100% gain for silver and tripling or quadrupling of the share price for many mining stocks.
********
To view the Gold Stock Bull portfolio, receive our highly-rated newsletter and get regular updates on the stocks that we believe will generate the greatest gains, click here to sign up for the Premium Membership.

Jason Hamlin is the founder of Nicoya Research and has been publishing investment research at goldstockbull.com since 2006. His background is in data analytics for the world’s largest market research firm. Jason consulted to Fortune 500 companies around the globe, including Nestlé, Johnson & Johnson and Del Monte. Jason eventually left the corporate world and leveraged his analytical skills to trade stocks successfully full-time. Jason is a contrarian, cycles investor and student of Austrian economics. He is a proponent of sound money, limited government, decentralization of power and the non-aggression principle (NAP). His website is at nicoyaresearch.com. You can reach Jason at: https://nicoyaresearch.com/contact-us/.


