Gold Price Nearing Cycle Bottom


In terms of time, a short-term secondary low is due for gold here in the current timeframe, originally projected for the February 7th date, but with the normal plus or minus variance of a day or two in either direction. The current decline comes as a result of the 10, 20 and 34-day cycles, each of which have been pointing south off the 1370 swing top - and with the combination of the same at or into normal bottoming territory.
The chart below shows the smallest of the above waves - the nominal 10-day cycle - which is currently 13 days along from its last labeled trough, and thus is looking for a short-term bottom:

In terms of price, my rule is that a cycle will revert back to a moving average of the same length about 85-90% of the time, with the 10 and 20-day moving averages easily met during the most recent correction. Having said that, the 34-day cycle has the 34-day moving average acting as a magnet (chart, below), and thus a bit more downside would tend to be in order, before that particular wave attempts to trough:
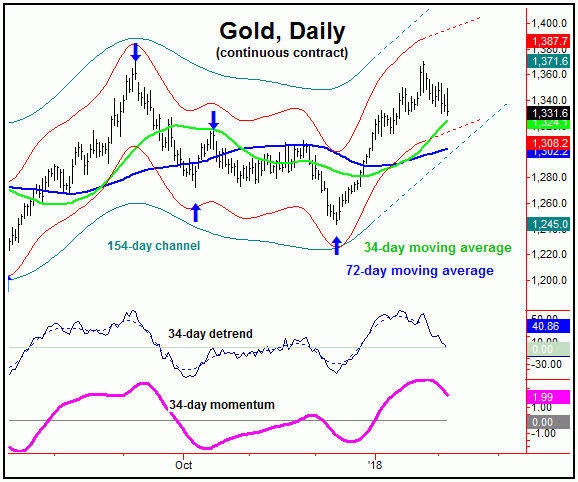
With the above then said and noted, the next swing bottom should come from the combination of the 10, 20 and 34-day time cycles, which is technically due at anytime - but with a particular focus on this February 7th timeframe (plus or minus) to end up as this expected cycle trough. In terms of patterns, this decline has been indicated to end up as a countertrend affair off the December, 2017 bottom, with the ‘ideal’ path favoring gold to remain above the 1298.00 figure (continuous and April, 2018 contract) on a closing basis.
Stepping back, a countertrend decline with the 34-day wave - if that is indeed the path that we see here - should be followed by a push back to or above the 1370 swing top into the mid-to-late February timeframe, on the next upward phase of the 34-day cycle. In turn, that move would be expected to peak the larger 72-day cycle (chart, above), for what is anticipated to be a larger correction phase into mid-to-late Spring:
Going further with the above, from whatever high that ends up forming with the 72-day cycle, the minimum expected correction should see a drop back to the 72-day moving average or lower, wherever it is at the time. Having said that, with a low not expected prior to the April or May timeframe, there is the full potential for a complete re-test of the 1238 swing bottom, registered back in December.
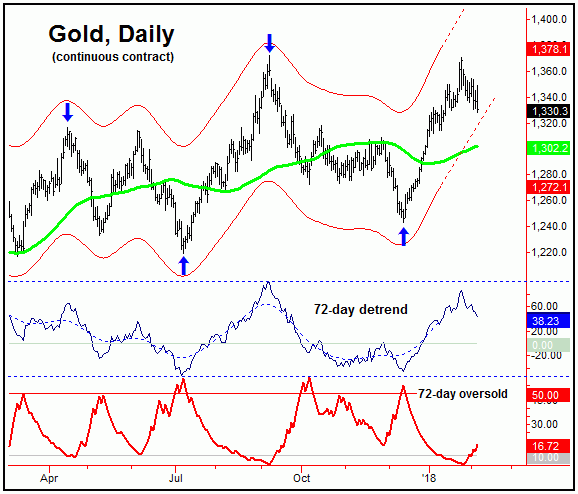
Going further with the above, from whatever high that ends up forming with the 72-day cycle, the minimum expected correction should see a drop back to the 72-day moving average or lower into mid-Spring wherever that key moving average is at the time. Having said that, there is the full potential for a complete re-test of the 1238 swing low (registered back in December of 2017) to materialize.
Stepping back further, if the decline seen into April/May (with the 72-day cycle) is able to remain above the 1238 swing bottom from December - which is anticipated - then the probabilities are above-average that the next upward phase of this 72-day component will take the metal back above whatever high that ends up being seen on the current rotation. In terms of time, the assumption is that this rally phase will last into the July or August, 2018 timeframe.
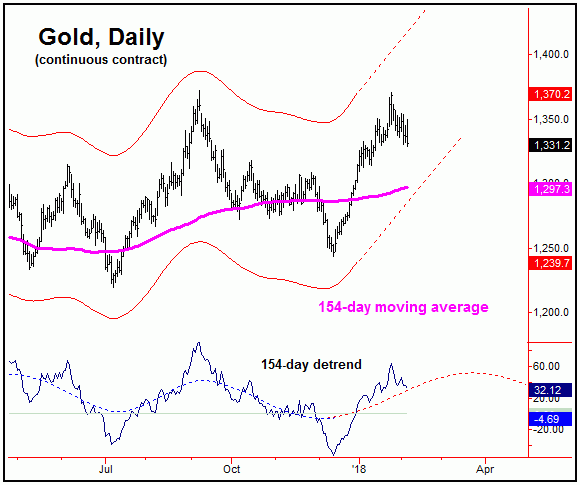
Stepping back even further, a rally high into the July or August should be in the range of 8-16% off the whatever low that ends up forming into mid-Spring; this is simply due to a low-end and average statistical analysis of this 72-day cycle, when coming off the pattern of a ‘higher-low’. From that high, a peak with the larger 154-day wave (chart, below) should be seen, a move which should be anticipated to give way to a larger-percentage decline into the seasonal bottoming window of November, plus or minus.
Having said all of the above, there is one ‘hitch’ at the present time, which comes from an assessment of our gold sentiment indicators, which are shown on the following chart:
The one thing that is glaring at the present time is the action of our gold sentiment index (upper pane, chart above), which has recently diverged from the 1370 swing top. This won’t always be a telling indication, though prior divergences have offered up pretty good signals for mid-term turning points in the gold market. For that signal to actually be triggered, however, our sentiment index would need to see a close below its lower standard-deviation band, which it may or may not do.
Lastly, in looking at other indications from sentiment, the commercial hedgers (lowest pane, chart above) are currently holding a sizeable net short position, though having covered about 9,000 of these from the prior week. Even said, I see the position of the hedgers as being a headwind for the gold market going forward, particularly in light of the position of the 72-day time cycle. Note: I have recently released my complete 2018 Gold Cycle Forecast, which covers the mid-term cycles, seasonal patterns, reversal point dates, sentiment and more - and is available on my website (http://goldwavetrader.com ).
The Gold Wave Trader


