Gold Price Rally Marked By Short Covering


If there was ever any doubt that the majority of buying by the hedge fund category in the gold market over the past 3-4 weeks has been of the nature of short covering, this week’s COT should put that theory to rest.
Since the third week of July, the hedge fund category alone has covered or lifted 40,000 short positions. That against the addition of only 16,000 or so new long positions over the same time span. By a better than 2:1 margin, hedge funds have been covering shorts, not instituting fresh purchases of gold.
In the following chart, I have combined the speculative category (hedge funds, large reportables and small specs) outright long and short positions and overlaid them upon a chart showing the price of gold.
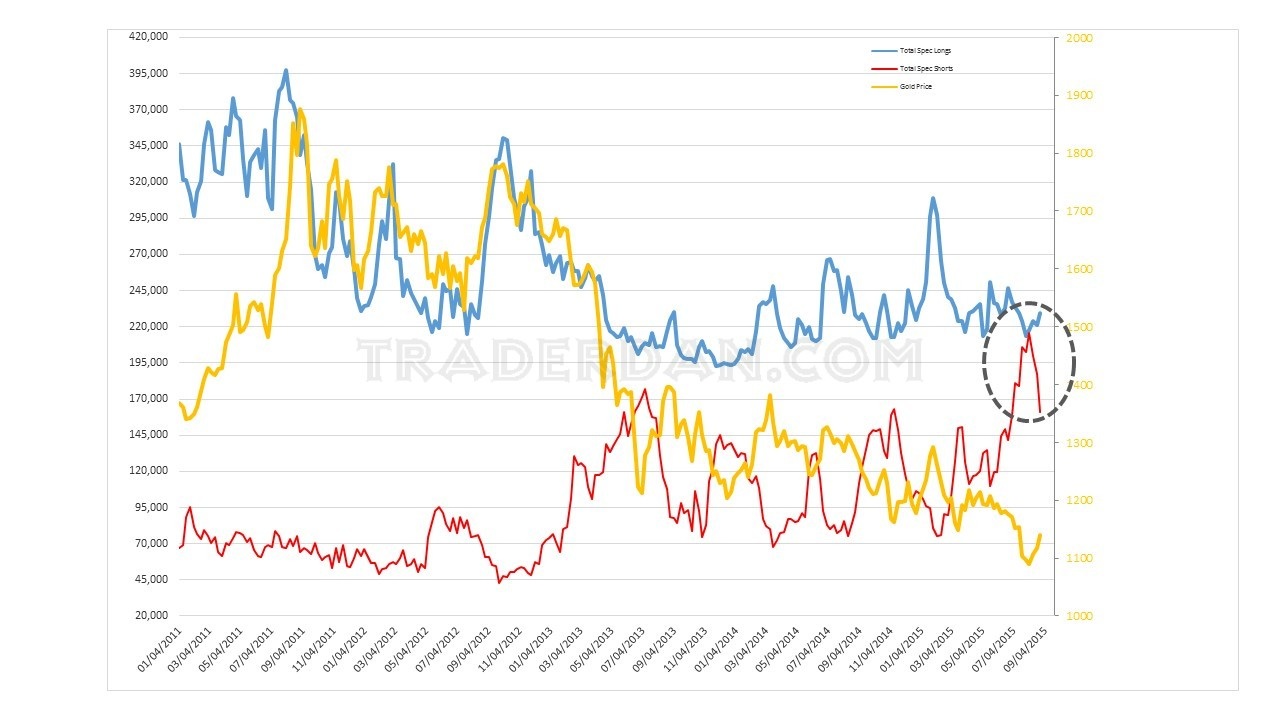
If you look at the move down from above $1200 that began in May, you can see that it coincided with the inception of a sharp spike in the number of speculative short positions. Along with that build in shorts, we got the usual long liquidation but the bulk of the selling pressure in gold was tied to fresh short sales.
Now that gold has recently moved higher, you can also see the predominant factor behind its rise, namely, a sharp reduction in the number of outright short positions being held by the speculative category.
As noted above, there has been a bit of fresh buying by specs but it pales in comparison to the buying attributable to short covering. In other words, it is short selling and short covering that is moving gold.
This is to be expected as the metal is responding to changes in perception of Fed moves on the interest rate front as well as equity market turmoil or the lack thereof.
Why is this important? Simple – as stated many times here at this site, in order for a market, any market, to mount a SUSTAINED MOVE HIGHER, it must have fresh or new buying. Short covering gains are spectacular as they are sharp, rapid and awe-inspiring, but the problem with rallies based on this factor is that they flame out almost as fast as they flamed on.
With the mining shares continuing their lackluster performance, and with the HUI/Gold ratio in the toilet bowl, I remain quite convinced that this recent rally in gold is nothing else but a mere rally in an ongoing bear market.

How far it might extend is unclear but its inability to push through and remain above those critical twin lows made in late April/early May and again in early June is telling.
For me to become at least a temporary believer in some further lasting upside potential, I will need to see this market post a strong close through those twin lows. Those just happen to be the exact level at which the gold rally was turned away this week. It comes in near the $1170 region.
Gold had spent a lot of time bouncing back and forth between $1170 – $1180 during parts of June before succumbing to selling pressure. Only a revisiting of that zone that meets with upside success can change the current bearish posture of this market.
If the bulls are going to be able to accomplish this, they had better get busy with the gold shares first.
Here is a bit of a closer look at gold using a shorter time span.
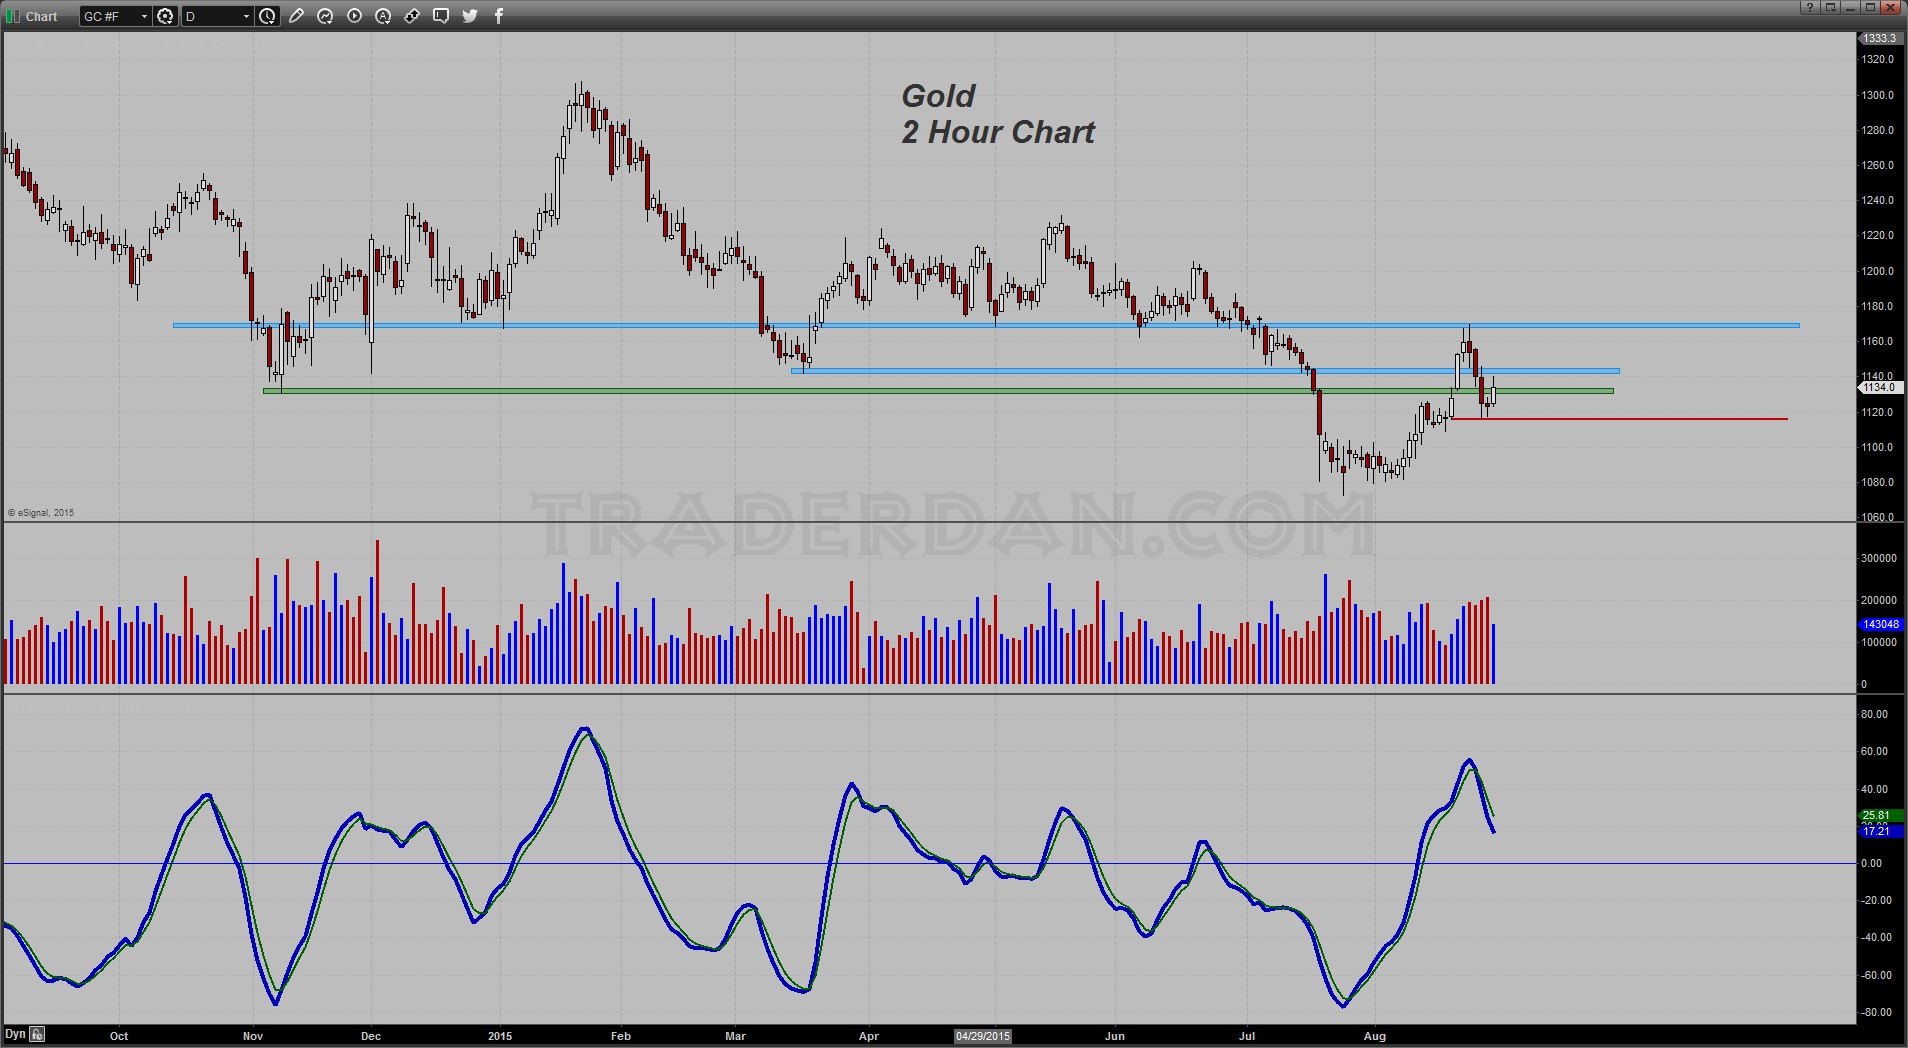
You can see the resistance areas very clearly on this time frame. You can also see the particular indicator is rolling over and is a sell mode at the moment.
********
Courtesy of Trader Dan http://traderdan.com/


