Gold Price Update


 On Thursday the dollar reversed dramatically to the downside and on Friday gold broke out upside, with both developments being predicated by the most bullish gold COTs for 14 years.
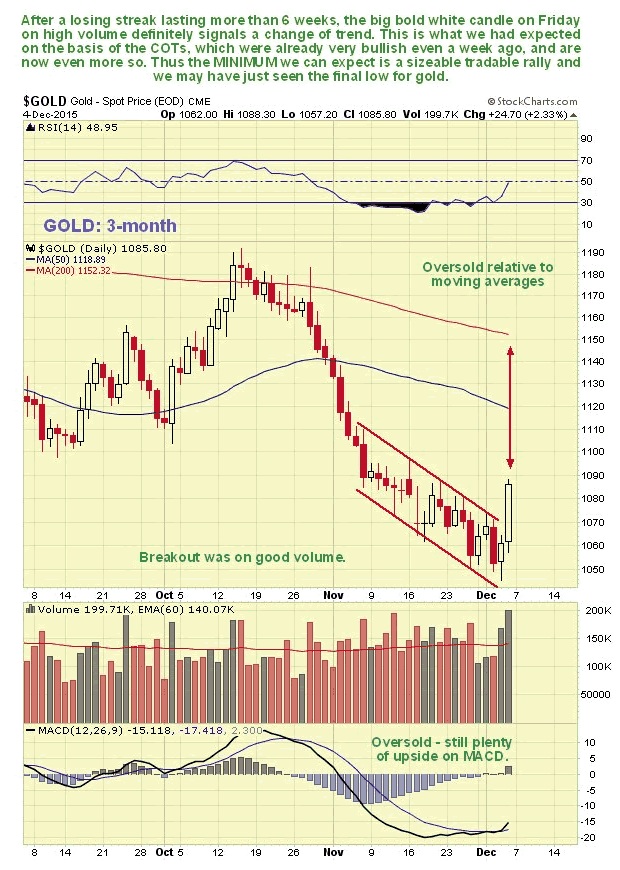
On gold's 3-month chart we can see that, after trying the patience of bulls for weeks as the COT pressure cooker intensified, gold finally broke out on Friday. This was a big decisive breakout on strong volume which COTs indicate is "the real deal". Fortunately the COTs were already so bullish a week ago that we went long ETFs, stocks and Calls before the breakout. As we can see, even after Friday's big move, there is lots more upside potential here, as gold is still heavily oversold on its MACD and way below its 200-day moving average.
Moving on to the 1-year chart, we can see why gold is turning up now, as it is at a classic cyclical low near to the bottom of the large downtrend channel shown. While it remains a fact that it is still in a downtrend, and its moving averages are still in bearish alignment, the super bullish COTs indicate that the least we can expect to see is a rally to the upper boundary of the downtrend channel, with the most being a breakout from the downtrend to kick off a major bullmarket phase.

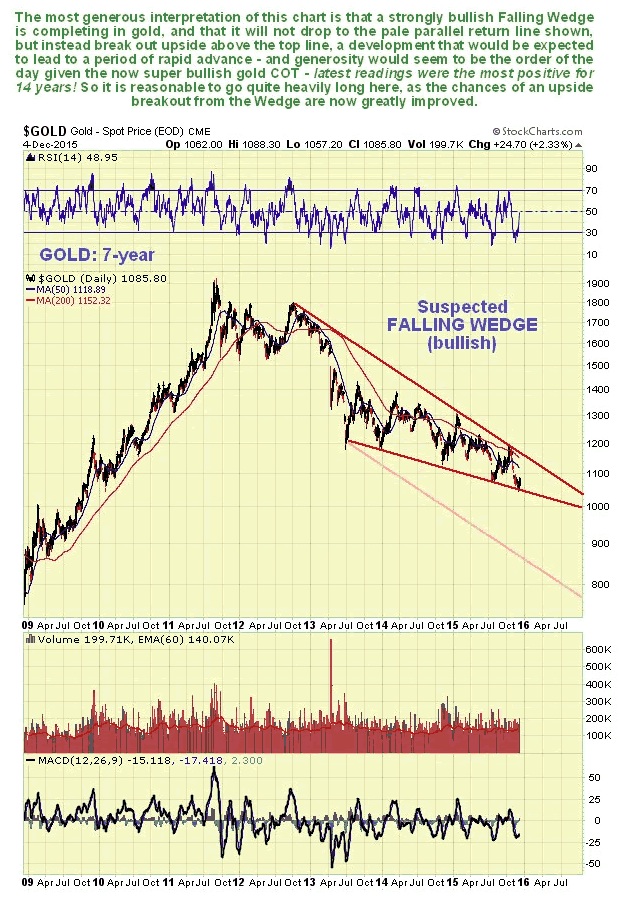
Bearing in mind the super bullish COT, which we will come to shortly, it is very interesting to observe on the 7-year chart that a strongly converging and correspondingly bullish Falling Wedge may be completing in gold. If this is so, then an upside breakout from this prospective Wedge should occur soon, and if that happens gold is likely to enter a phase of rapid advance. The intensifying disparity between the amount of physical gold supply available and the avalanche of naked shorting of paper gold that has been used to suppress the price until now has created the conditions where an upside breakout from this Wedge could drive a massive spike. The pale red parallel channel line below caters to a worst case scenario that we were earlier wary of, but this has been rendered obsolete by the latest super bullish COTs. There is always the chance that the COT structure will rapidly deteriorate as the price of gold approaches the upper channel boundary, presaging a reversal to the downside again, but this is considered unlikely, and we will cross that bridge when we come to it.
Now to the latest COT, which as you can see makes plain why gold suddenly came bursting through the gate on Friday. The Commercials have now unloaded almost all of their shorts, and have not had such a low short position in gold (virtually non-existent) since late 2001. This tells you all you need to know - which is that we can expect a thumping great rally, even if the bearmarket up to now re-asserts itself later, which it may not - this COT is so bullish it may signal that gold's final low is in and it goes up from here. This should not really come as a surprise considering that we are headed in the direction of a major currency crisis, economic collapse and war, which not even the likes of Apple, Facebook and Netflix will have the power to deflect.

On we go to consider the startling reversal in the dollar on Thursday on its 3-month chart, which precipitated gold's breakout on Friday. Even though we knew it was likely from gold's COTs a week ago and from the Rising Wedge forming on the dollar chart, it was still of shocking magnitude, with the dollar index dropping by 2.3% in just one day, a massive move for a major currency. Ostensibly it was caused by the market's reaction to remarks by Draghi, the head of the ECB, but gold's COTs a week ago showed that this move was already "baked in" and Draghi was simply the catalyst or excuse. The point is that a move of this magnitude following a lengthy period of advance almost always signifies a major reversal. This drop may mark the beginning of the end for the dollar.
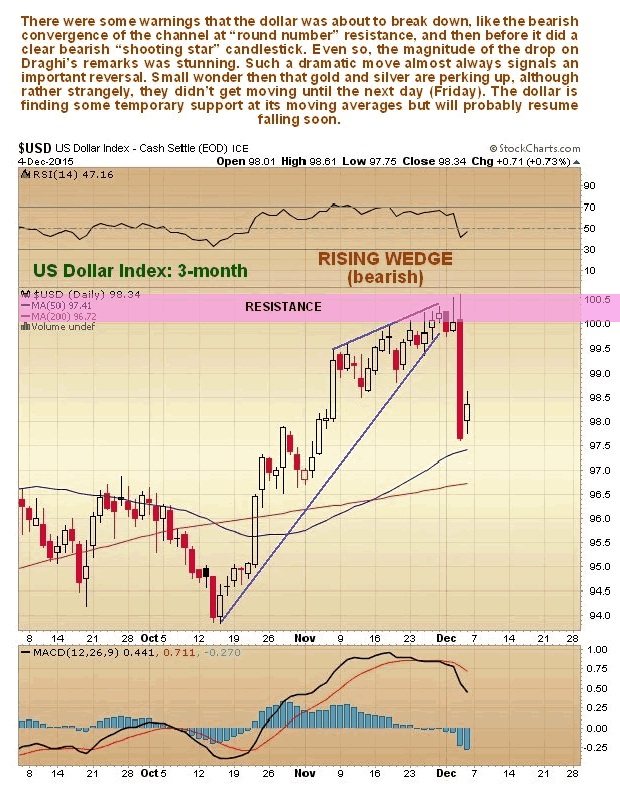
The importance of this dramatic turnaround in the dollar is further emphasized by where it occurred, which as we can see on the 18-month chart for the dollar index, was right at resistance at the March highs and at "round number" resistance at 100. What might be happening is that the dollar is building out a Double Top. Certainly it would seem to be wise to get out of dollar investments here and only consider getting back in if the dollar index can succeed in breaking above 100.

Conclusion: gold broke out convincingly on Friday to start an intermediate uptrend that will result in worthwhile gains from here for a wide range of investments across the sector. While the bear market may reassert itself later, latest gold COTs are so bullish that we may have seen the final low - it may be over. We will know if it succeeds in breaking out of the Falling Wedge shown on the 7-year chart.
********
Courtesy of Courtesy of http://www.clivemaund.com

Clive P. Maund’s interest in markets started when, as an aimless youth searching for direction in his mid-20’s, he inherited some money. Unfortunately it was not enough to live a utopian lifestyle as a playboy or retire very young. Therefore on the advice of his brother, he bought a load of British Petroleum stock, which promptly went up 20% in the space of a few weeks. Clive sold them at the top…which really fired his imagination. The prospect of being able to buy securities and sell them later at a higher price, and make money for doing little or no work was most attractive – and so the quest began, especially as he had been further stoked up by watching from the sidelines with a mixture of fascination and envy as fortunes were made in the roaring gold and silver bull market of the late 70’s.
Clive furthered his education in Technical Analysis or charting by ordering various good books from the US and by applying what he learned at work on an everyday basis. He also obtained the UK Society of Technical Analysts’ Diploma.
The years following 2005 saw the boom phase of the Gold and Silver bull market, until they peaked in late 2011. While there is ongoing debate about whether that was the final high, it is not believed to be because of the continuing global debasement of fiat currency. The bear market since 2011 is viewed as being very similar to the 2-year reaction in the mid-70’s, which was preceded by a powerful advance and was followed by a gigantic parabolic price ramp. Moreover, Precious Metals should come back into their own when the various asset bubbles elsewhere burst, which looks set to happen anytime soon.
Visit Clive at his website: CliveMaund.com


