Gold Price Update


The key message of this update is that gold is getting closer and closer to breaking out of a giant Head-and-Shoulders base pattern that started to form back in the middle of 2013 and to point out that it won’t be stopped from doing so by any minor short-term reaction, especially as the dollar has just broken down from a giant top pattern and looks set to plummet, notwithstanding any near-term rally to alleviate its oversold condition.
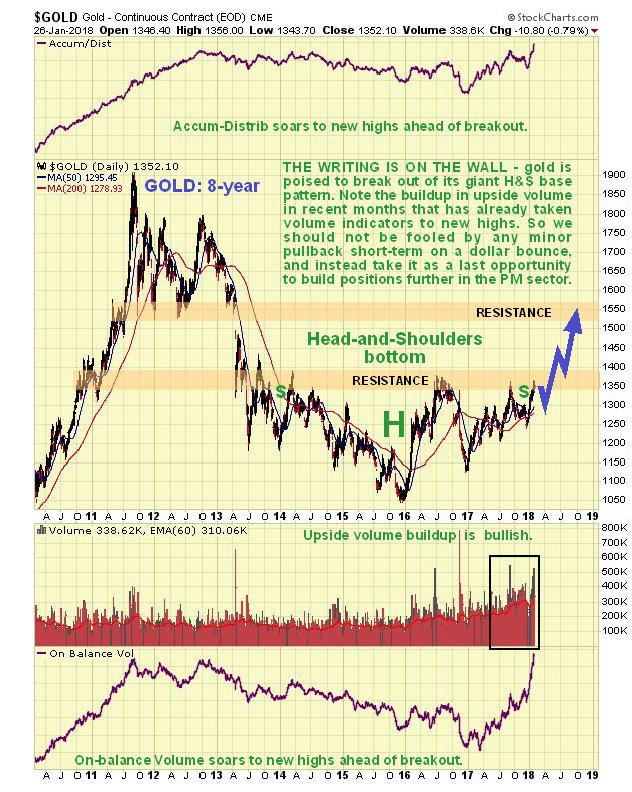
We’ll start by looking at the latest 8-year chart for gold which shows a fine flat-topped Head-and-Shoulders bottom. We can observe how a large and lengthy Right Shoulder has formed following the mid-2016 peak, which complements the large and lengthy Left Shoulder, making the pattern symmetrical, even if its component parts are a rather messy. We see how the price has risen up in recent months to challenge the resistance at the upper boundary of the pattern, and most importantly these runs at the resistance have been accompanied by a quite dramatic volume buildup, that has now driven both volume indicators to new all-time highs. This action by both volume indicators concurrently is very bullish indeed – it means that gold is destined to break out upside from this pattern into a bullmarket soon, regardless of what efforts the supposed “cartel” with their paper shenanigans make to stop it, and it’s not hard to see why given how much physical has been mopped up in recent years by countries such as China, that understand gold’s true value. Upon breaking above the nearby band of resistance, the 1st target for gold is the quite strong resistance in the $1520 - $1560 area.
On gold’s 6-month chart, however, we can see that it has had a nice run in recent weeks that has resulted in it becoming rather extended, and with sentiment readings now very bullish, we should not be surprised to see a modest pullback that would probably be occasioned by a relief rally in the dollar to alleviate its oversold condition. We can use any such pullback to do additional buying, especially of gold and silver stocks.

Gold’s latest COT shows that Large Spec long positions have risen to quite a high level, not enough to prevent it rallying further, but to a level that makes a reaction back more likely, and any such reaction would put gold in a stronger position to mount a sustainable breakout a little later.

Click on chart to popup a larger clearer version.
The 8-year chart for the GDX shows a large Head-and-Shoulders bottom completing that parallels the one in gold itself, the main difference being that GDX is still a lot closer to its Right Shoulder lows than gold itself, which means that we are still at a good point to accumulate gold and silver stocks, and it will be even better if we see a minor dip over the short-term as shown.

On the 6-month for GDX we can see that it has had a good run since mod-December, like gold itself, but being close to resistance now and starting to roll over, there is fair chance of its dropping back some towards its moving averages, and if it does it will present an even better opportunity to buy mining stocks at better prices.

A big reason for gold getting ready to break out is the dollar having just broken down from its large Broadening Top formation, which happened over the past 2 weeks. On the 8-year chart for the dollar index we can see that this looks like a clear and decisive breakdown, and while it will be normal for it to now rally back in a deceptive manner over the near-term to the lower boundary of the Broadening Top, it should then go into decline again and drop swiftly to its initial downside target in the 80 area, as shown by the red arrow on the chart. Obviously, such a drop is very big and will have major ramifications for most markets, not least of which is the Precious Metals market.

On the latest dollar index 3-month chart we can see its breakdown move this month in detail, and we can also see how it has become very oversold on short-term oscillators, making a near-term rally to relieve this oversold condition likely. Thus it is interesting to observe that a bullish looking hammer-like candlestick formed on Thursday, and we now want to see the volume associated with this candle which we can do via a proxy, but first we should note how far any rally is likely to get – it will probably get no further than the resistance at the underside of the bear Flag that formed about a week ago, as shown on the chart, which should coincide with a minor dip by the Precious Metals sector.

The 3-month chart for dollar proxy PowerShares DB US Dollar Index Bullish Fund (UUP) showed that at the time that hammer-like candle formed on the dollar index chart on Thursday, a large white candle formed in UUP on very strong volume, driving it Accum-Distrib line steeply higher. This is a strong sign that a relief rally is about to start in the dollar, although as detailed above, it shouldn’t get very far before the larger downtrend reasserts itself.

So there we have it – a very bullish picture for gold indeed, notwithstanding any short-term dip, and it is worth pointing out in closing that rising interest rates are good for gold, and that a reversal in the stockmarket will also be good for it, as gold will be in demand again as a safe-haven, especially as Treasuries are no longer an option, and with everyone bullish on the stockmarket now, and everyone who wants in in, a reversal looks imminent.
*********

Clive P. Maund’s interest in markets started when, as an aimless youth searching for direction in his mid-20’s, he inherited some money. Unfortunately it was not enough to live a utopian lifestyle as a playboy or retire very young. Therefore on the advice of his brother, he bought a load of British Petroleum stock, which promptly went up 20% in the space of a few weeks. Clive sold them at the top…which really fired his imagination. The prospect of being able to buy securities and sell them later at a higher price, and make money for doing little or no work was most attractive – and so the quest began, especially as he had been further stoked up by watching from the sidelines with a mixture of fascination and envy as fortunes were made in the roaring gold and silver bull market of the late 70’s.
Clive furthered his education in Technical Analysis or charting by ordering various good books from the US and by applying what he learned at work on an everyday basis. He also obtained the UK Society of Technical Analysts’ Diploma.
The years following 2005 saw the boom phase of the Gold and Silver bull market, until they peaked in late 2011. While there is ongoing debate about whether that was the final high, it is not believed to be because of the continuing global debasement of fiat currency. The bear market since 2011 is viewed as being very similar to the 2-year reaction in the mid-70’s, which was preceded by a powerful advance and was followed by a gigantic parabolic price ramp. Moreover, Precious Metals should come back into their own when the various asset bubbles elsewhere burst, which looks set to happen anytime soon.
Visit Clive at his website: CliveMaund.com


