Gold, Silver & Dow Jones Step Sums
 In early November we find the Dow Jones moving from one new all-time high to the next while the price of gold (and silver) only seem to go down, that is until today. This is certainly not hard to understand; the Western central banking system wants valuations in financial assets like stocks and bonds to go up, the price of gold and silver to go down, and European national governments to stop asking the Federal Reserve and Bank of England to return their gold reserves.
Saying this doesn’t make me a conspiracy theorist; central banks intervene every day in every market as viewers of CNBC are constantly informed. Currently the West’s central bankers have the means to impose their will on these markets, but their ability to oppose natural market trends using counterfeit money will ultimately prove to be suicidal. How long will that take? I haven’t a clue, but I believe that we are closer to the end of these declining precious metals and rising share price trends than the beginning. So that makes this is a good time to review the step sums for gold, silver and the Dow Jones.
The step sum is a single item advance – decline line using the daily closing prices of a market series. The table below shows the construction of the step sum for gold and the Dow Jones for the past month. If gold or the Dow Jones closes higher than the previous trading day’s close, it’s a +1 step; if it closes lower it’s a -1 step. The step sum is a simple total of the daily up and down steps, which for the table below began in January 1969.
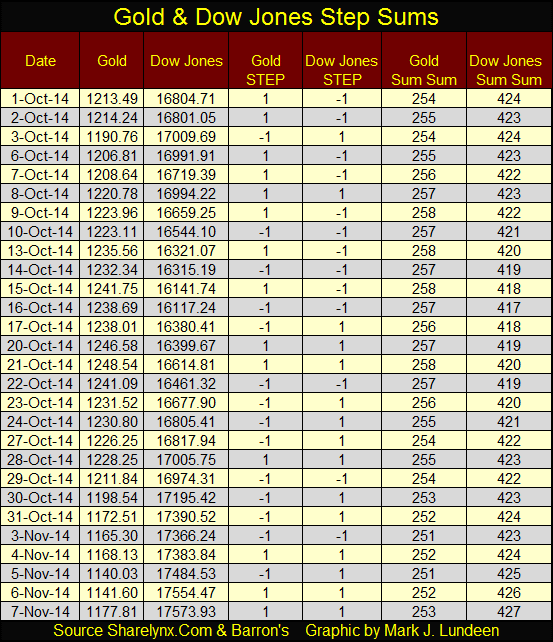
One fact that never ceases to amaze me is that during every bull or bear market the number of up and down days are approximately equal. Take a look at the Dow Jones data above; since October 01 it has moved up 769 points with an increase of only 3 steps in its step sum, while gold’s step sum has declined only 1 step on a price decrease of $36.
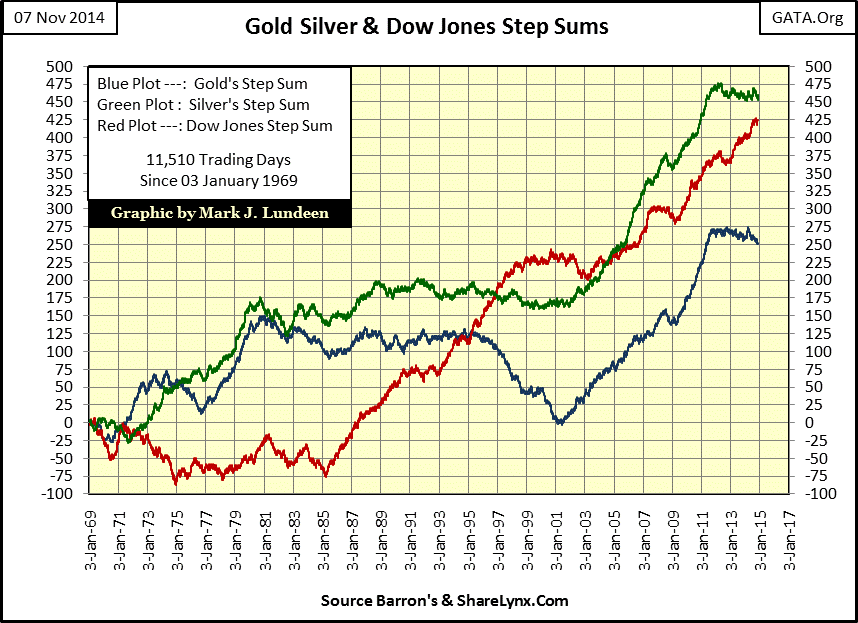
Since January 1969 to present (chart below) we see a period of 11,510 trading days over the past forty-five years, yet none of the step sums plotted below have managed to move more than 500 net daily steps through both bear markets and bull. Yet studying the step sum does show us that it tends to rise in bull markets, and decline during bear markets, but as we’ll see, this is not always so.
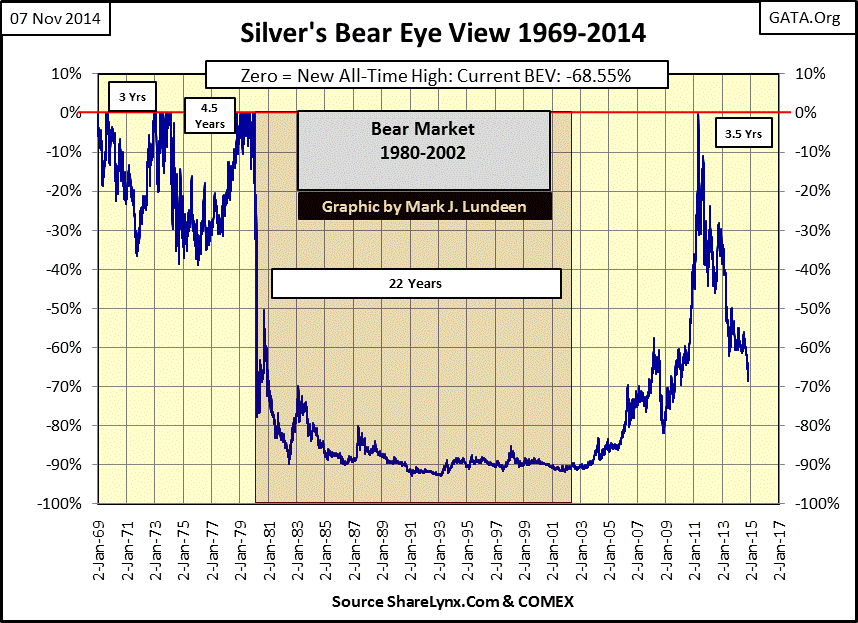
Silver (Green Plot above) has seen the most daily price advances of the three plots above, yet its last all-time high still dates back to January 1980, thirty five years ago. This as gold’s last all-time high was as recent as August 2011 and the Dow Jones saw three new all-time highs just this week. Since then silver has been through one twenty-two year, 92% bear market decline and is currently 68% below its peak in late April 2011. Incredibly, even after these massive bear market moves, silver has still seen more daily advances since 1969 than either gold or the Dow Jones.
So, what use is silver’s or any indexes’ step sum? It’s a sentiment indicator of the only people whose opinion actually matter in any market; those who show up day after day to buy and sell, the people who the market rewards for being right, and punishes for being wrong. The best example of the usefulness of the step sum can be seen in the gold market below. From 1969 to gold’s 1980 top (Blue Plot / Left Scale), we see gold’s step sum (Red Plot / Right Scale) following faithfully the rises and falls in the price of gold; but all that changed during gold’s 1980 - 1999 bear market.
From January 1969 to 1980, gold increased from $43.50 to $825 as its step sum advanced 142 steps. Then, as the price of gold collapsed 65.84% from January 1980 to February 1985, it did so as its step sum declined only 41 steps. Two years later the gold market developed what I call a Bear Box, when for eight years gold’s step sum (market sentiment) absolutely refused to decline along with the price of gold.
Today we can look at these plots with cold detachment. But from 1980 to about 1995 investing in the gold market was an emotional commitment for both private citizens and investment advisors who had never gotten over the US Government’s August 1971 decoupling of the dollar from the Bretton Woods $35 gold peg. The 1969 -1980 gold bull market was completely expected by the gold bulls. However the very idea of seeing the price of gold suffering in a nineteen year bear market as the Federal Reserve continued to expand the money supply each and every week following gold’s 1980 top was absolutely rejected by the gold bulls. This can be seen in both the pro-gold investment advertisements and expert commentary in old issues of Barron’s, as well as in gold’s step sum above.
The gold bulls believed that monetary inflation had to flow into the price of gold, but during the bear box above the bulls were wrong, as monetary inflation flowed into the stock market instead. The dashed line in the bear box shows the approximate date when the bear box closed or was terminating as gold’s step sum began its collapse; the moment in time when the gold bulls could no longer afford to deny that gold was in a bear market. The 1990’s bulls may have invested in gold, but what they actually wanted was a return of more dollars than they had invested. But back in the late 1990s, the place to buy low and sell high was in high-tech stocks. So, beginning in 1996 the gold bulls began to sell their gold, and taking their long delayed losses they moved on to the greener pastures the NASDAQ.
In 1996, just as Greenspan’s stock market bubble entered its mania phase, bullish market sentiment for gold collapsed (as seen in the gold declining step sum), taking the price of gold down to its ultimate bear market low of $253 in July of 1999. Note what happened to gold’s step sum (gold-market sentiment) after July 1999; it continued collapsing for another two full years after the price of gold hit its ultimate bear market bottom. Market sentiment for gold at the turn of the century became toxic. Although some people may have been purchasing gold in the late 1990s and early 2000s, at that time it wasn’t something one bragged about.
Then in February 2001 the price of gold bounced off $255 and began its decade long advance. Ten months later in November 2001, gold’s step sum also bottomed and turned upward, marking the start of gold’s second bull market since Bretton Woods. What should interest us now is that ever since August 2011, gold has formed another bear box. With the price of gold now 40% below its last all-time high of August 2001, its step sum (market sentiment) has stubbornly refused to follow. How can this be?
With all bear boxes, the step sum (market sentiment) differs greatly from price action for a prolonged period of time. But the question to be answered is: who in November 2014 is correct; the gold market’s bulls or the bears? During gold’s 1988-96 bear box, the bulls were proven wrong; but there have been other step sum bear boxes when the bulls were ultimately proven right.
This is what I expect will happen with gold’s current bear box because of who the bulls are: disgruntled Asian Central Banks, for example the Bank of China. Note the date of the quote below, just as Doctor Bernanke began his program of quantitative easing.
“We hate you guys. Once you start issuing $1 trillion-$2 trillion [$1,000bn-$2,000bn] . . .we know the dollar is going to depreciate, so we hate you guys but there is nothing much we can do.”
- Luo Ping, a director-general at the China Banking Regulatory Commission, 11 February 2009
Mr. Luo of the Bank of China may have pretended not to know what to do in February 2009, but the Bank of China has been a huge, wholesale purchaser of gold, both since then and before. If gold’s step sum hasn’t followed the price of gold down since 2011, it’s because on the following day the western central banks whack the price of gold, and the Bank of China is in the market purchasing as many tonnes as it can at steeply discounted prices.
Alasdair Macleod of Goldmoney.com put out a piece last week which suggests China may already have accumulated between 20,000 and 25,000 tons of gold prior to 2002. A great discussion of this by Bill Holter from Miles Franklin can be found here.
“Macleod believes that China has been playing possum regarding their gold reserves. If you recall, China announced in 2009 they had accumulated a whopping 1,054 tons of gold. The news at the time was a huge surprise and led to bullishness in the gold market as China was then a confirmed buyer. This total vaulted them into the major leagues of gold hoards. If Macleod is correct about holdings of 20-25,000 tons AS OF 2003, why would China want to “lie” about how much gold they have accumulated? It is important to understand the mindset of the Chinese and the deep rooted thought process instilled in them by General Sun Tzu. “Deception” is a core strategy to war, under this category would come the thought to “help your opponent in his underestimation of you.” Why would the Chinese announce true or huge holdings if it was their intent to continue increasing their hoard of gold? They wouldn’t.”
Gold’s step sum bear box of the 1990s only closed because the bulls purchased their gold with the expectations that it would ultimately increase their net worth in terms of dollars. In 1996 with the stock market on fire, the stubborn bulls finally began selling their gold at a loss and moved on to the greener pastures of the NASDAQ. Today’s gold bulls (Asian Central Bankers) find the ever expanding number of dollars on their balance sheets alarming, and are buying thousands of tonnes of gold as a means of reducing their exposure to a US dollar debacle. Gold’s step sum began collapsing in 1996 as the gold bulls finally capitulated and sold their gold for dollars, but today’s gold bulls have no intention of ever selling their gold.
I suspect that gold’s current bear box will not “close”, where we would see its step sum collapse down toward its still declining price plot. Rather, at some point in the near future I expect gold’s current bear box will become “invalidated” as its price plot reverses, rising upwards and taking its step sum with it to new all-time highs. That is how I read the tea-leaves in the gold market, and I’m fully convinced that I will be proven correct in the not too distant future.
Next up are step sum charts for gold, silver and the Dow Jones using dollars instead of a BEV plot (as used above). The first chart gives an excellent view of gold’s current massive bear box, as well as a short lived four month bear box during the mortgage crisis. The gold bulls, old fashioned dudes that they are, just couldn’t believe that the price of gold could do anything but go up as the global banking system melted down. Just as during the 1980-1999 bear market they were once again wrong. However in 2008 it took the bulls a mere four months to figure out the game was rigged; gold’s step sum soon followed the price of gold down.
Currently gold is in a thirty-nine month long bear box, with market sentiment (the step sum) showing little indication of collapsing. As I’ve speculated above, this is most likely because the bulls are Asian central banks who for years have been more than happy to discreetly exchange a few hundred billion worthless fiat dollars for as many tonnes of gold as they can get. Declining gold prices will never panic these 21st century bulls, so I doubt we’ll see the step sum collapse in the bear box above. Instead I expect it will be “invalidated” meaning that gold’s price plot will reverse, going on to new all-time highs and taking its step sum with it.
Next we see an amazing chart of silver and its step sum. In the 42 months since April 2011 the price of silver has plunged 68% as its step sum declined by a net of only six days. During the 2008-09 credit crisis silver’s step sum fell by 20 days in only five months, as its price declined 58%. What’s up with that? Well our 21st century silver market bulls are proving to be price insensitive just like the gold bulls (they are likely one and the same). They already have more dollars than they want, dollars they are more than happy to exchange for silver at any price.
For the bulls whose purchases of silver drive the movements of its step sum, unlike retail silver investors, lower silver prices don’t inspire thoughts of selling but of buying more. Ultimately this will prove to be fantastically bullish, because unlike the global supply of dollars, which (thanks to the Federal Reserve) can expand by trillions of dollars in a very short time, the supply of actual silver is both finite and small.
Here is something to keep in mind; after a big slap down in the price of silver, (courtesy of the “policy makers” in the paper futures markets), you and I may feel more than a bit depressed; but silver’s step sum above strongly suggests that the true silver-market bulls, (the people who come to buy physical silver wholesale every day) are going to keep buying silver at any price. Here in the West we have a very bad habit; we value everything in terms of a wasting asset: the US dollar. We believe that the more dollars something costs, the more valuable that something is. But this is no longer the market view of many people of influence in Asia, for example Mr. Luo Ping of the Bank of China (quoted above).
Here is the Dow Jones and its step sum. Note the three bubbles in the Dow Jones (Blue Plot):
- High Tech Bubble
- Real Estate Bubble
- Global Bond Bubble
Note also that the Dow Jones’ step sum never really collapsed during the bear markets following the High-Tech and Real Estate bubble tops.
The 2007-09 bear market (with its 54% decline) was the Dow Jones second deepest bear market since 1885. How could the Dow Jones endured such a devastating collapse with a step sum decline of only twenty three days? Well, as with the current bear boxes with gold and silver, the big stock market bulls of the credit crisis were governmental agencies with deep pockets, namely the Federal Reserve and US Treasury Department.
Again, this isn’t conspiracy theorist stuff. Fed Chairman Doctor Bernanke and Treasury Secretary Hank Paulson asked for, and received Congressional permission on live TV to “support market valuations”; a euphemism for them to buy ever more stocks as the share prices declined from October 2008 to March 2009. In other words, during the second worse Dow Jones bear market since 1885, the stock market bulls, the people who showed up every day during the credit crisis to buy stocks never gave up, they were never forced to exit their bullish positions at a loss. So not only did the Dow Jones’ step sum not see a proper collapse, the stock market was never allowed to find its free market valuation.
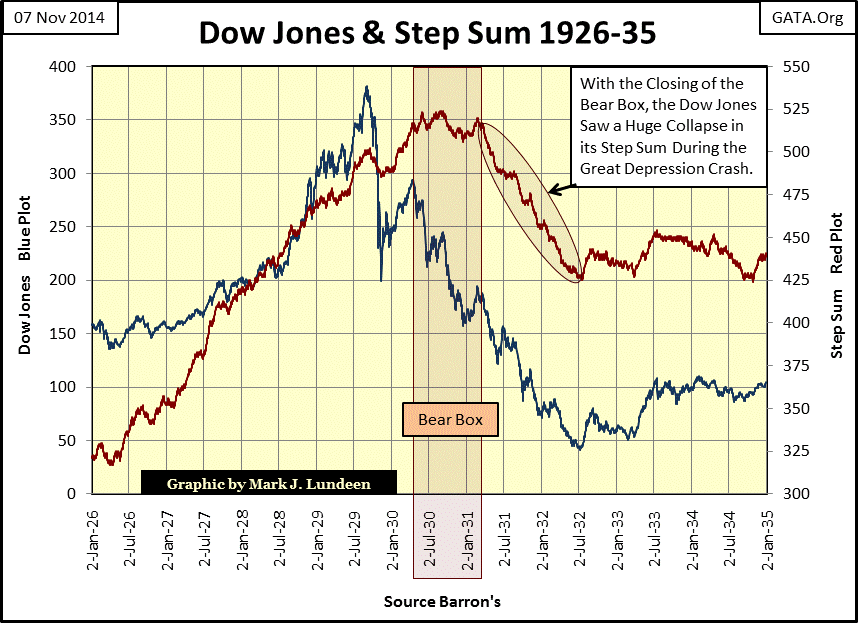
Let’s look at what happened during the Great Depression market crash, the #1 Dow Jones bear market in the chart below. The market plummeted from October through November 1929, followed by the Dow Jones rebounding until March 1930 with the Dow’s step sum following along. Then in March 1930 the Dow Jones and is step sum began a twelve month bear box. Every day the stock-market bulls came to work and bought stocks that continually seemed to become “bigger and bigger bargains.” In March 1931, all hope that the stock market would rebound proved forlorn when stocks became so cheap that the bulls finally went bust. In the chart below we see exactly when the bulls left the field of battle to Mr Bear – when the Dow Jones step sum began its collapse in March 1931.
Since March of 2009, Wall Street and Washington have managed to “restore market stability” via monetary inflation (also known as Quantitative Easing), injecting trillions of make believe dollars into the banking system. Why would they think they can get away with this fraud? I have a feeling that the day will come when once again they will have to do battle with Mr Bear. However this time the big stock market bulls will be overwhelmed by the big furry fellow, and we’ll see a proper collapse in the Dow Jones step sum.
In the final analysis, the failure of the Dow Jones to see a proper collapse in its step sum back in 2009 is directly connected to the refusal of the current gold and silver step sums to collapse. Foreign governments and their central banks understand exactly what is going on in the US financial markets, and want no part of it. They are voting their objections by using their excess dollar reserves to buy as much gold and silver as they can without starting a buying panic in the precious metals market. But following this, the bull market in gold and silver that began in 2001 will resume. So like the Asian central banks, we should take advantage of today’s subsidized low prices for gold and silver while they last.


