Gold & Silver Go BOOM


 "Finally!” in English, “Por fin!” in Spanish and “About bloody time!!” in Australian. The belated rally in gold and silver finally got underway when it was least expected. The contrarian wins again!
The final bear market rally in gold and silver kicked off after a fake out move lower and should end with a fake out move higher. That’s the way I see it anyway. Of course the perma-bulls will be back out in force again calling the next great bull market now in progress -- and this rally should terminate when those calls reach fever pitch.
Let’s take a look at the charts beginning with gold.
GOLD WEEKLY CHART

We can see price recently breaking down below the triple bottom support level at US$1,180. This led to a throng of analysts calling doom and gloom and Armageddon dead ahead for gold. What they failed to comprehend was that this support was just too obvious and when something is that obvious then what follows will generally not be what popular consensus dictates.
Now determining the contrarian position is easier said than done but these setups don’t get much easier than what we have just witnessed with gold. The break of obvious support combined with the plethora of bearish forecasts was the perfect setting for a rally. That is, when people least expect it.
So we have a false break low in place at US$1,132. The recent triple bottom support became resistance and recovering above there now is a bullish sign.
The low was also accompanied by bullish divergences on the Relative Strength Indicator (RSI) and Stochastic indicator. Nice.
So how high can we expect this rally to reach?
I have drawn a green highlighted rectangle which I’ve labelled the Voodoo Fake Out Zone. The bottom of this zone is the July 2014 high at US$1,339 while the high is the March 2014 high at US$1,387. I expect price to trade up into this area. Why?
Firstly, the black down-trending line which I’ve drawn across the tops of August 2013 and March 2014 will provide the first fake out. This trend line is on the radar of virtually all chartists so it is very obvious. That fact alone means it will probably be a fake out. But don’t tell the other chartists that!
Busting above this trend line will get the gold bulls hooting and hollering with giddiness. That should lure in more bulls for the slaughter. That next round of buying should provide price with the momentum to trade up into the next fake out area – the Voodoo Fake Out Zone.
The bottom of the zone is the July high which many Elliott Wave technicians have labelled wave 4. So taking out that level would imply the recent low is the final wave 5 low. They will be jumping on the bullish bandwagon when they see price trade above the “wave 4” level. This will be the final fake out and I can already see their flummoxed expressions when price turns back down.
If my analysis is correct, price should not trade above the March 2014 at US$1,387. If it does then it will be me that is flummoxed. I doubt it.
I have added Fibonacci retracement levels of the move down from August 2013 high to the recent low. I’m looking for price to get up to around the 76.4% level which stands at US$1,361. I suspect a touch higher.
Let’s move on to the monthly chart.
GOLD MONTHLY CHART

I have added Bollinger Bands which show price finding support around the lower band. I now expect price to trade back up to the upper band which is currently just above US$1,360. This toing and froing between the bands is consistent with a consolidating market.
The lower indicators, being the RSI, Stochastic and Moving Average Convergence Divergence (MACD) indicator, are all showing this recent low to be accompanied by bullish divergences. More evidence that a decent rally higher is at hand.
I have the Parabolic Stop and Reverse (PSAR) indicator, which pertains to the dots, and I expect this rally to trade up and bust these dots in order to unwind the bearishness given from this indicator. That would then set the stage for the move to final lows.
I have added Fibonacci retracement levels of the move up from 2008 low to 2011 high. This recent low was right around the 61.8% level so price finding support now was no surprise. Well, not to me anyway.
Once this rally is over I am looking for price to make its final low around the 76.4% level at US$973. This is also close to one of Gann’s favourite bottom targets being 50% of the high price which would be US$960 in this case. And importantly, both these levels stand below the psychological US$1,000 level.
Finally, we now have a “three strikes and you’re out” low formation in play. That is, three consecutive lower lows. This recent low was the second low so we now just require the third and final low. Now because this second low was only marginally lower than the first low I expect the third and final low to be much lower than the second low. A low sub US$1,000 looks to fit in perfectly here.
As for the timing, May is a seasonally low point for gold so I’m looking for the final low to occur in May 2015.
Now let’s rip out some Voodoo magic with the yearly chart.
GOLD YEARLY CHART

The RSI still has a reading in positive territory consistent with bull market pullbacks while the MACD has a bullish bias with the blue line above the red line.
I have drawn voodoo style the 2015 candle. This is how I expect price to trade next year. It calls for one final plunge which should find support close to the 14 period moving average. Then a big reversal which sees price close out the year with bang. I haven’t yet drawn the 2016 candle but I suspect it will be challenging, if not taking out, the all-time high set in 2011 at US$1,920. Yeeeeehaaaaa!
Let’s now check out the silver action.
SILVER WEEKLY CHART
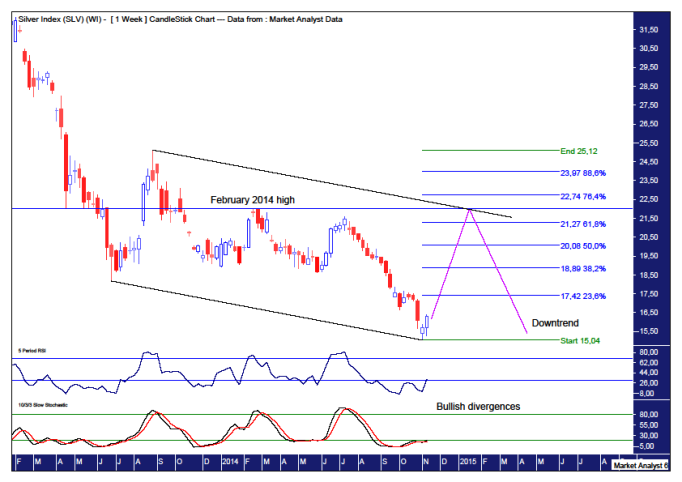
The recent low was accompanied by bullish divergences in the RSI and Stochastic indicator.
I have been presumptively prognosticating the formation of a downtrend channel. We now appear to have the angle determined now that the recent low is in place. However, this downtrend channel is still not obvious so I expect this rally to end once it reaches the top of the channel.
Interestingly, price reaching the top of the channel in early 2015 will be right around the February 2014 high level at US$22.03. This potentially sets up a bearish double top with the trend. Something to keep in mind.
I have added Fibonacci retracement levels of the move down from the August 2013 high to recent low. Price getting up to the top of the trend channel would be just above the 61.8% level. I doubt price will have enough ticker to get to the 76.4% level at US$22.74. Let’s see.
Once the rally high is in place then the downtrend channel will likely become obvious with calls for a move back to the bottom of the channel. Duh! Considering it will be obvious, then that will likely not happen. I favour the the third and final low pulling up just short of the bottom of the channel. Personally, I’m looking for the final low to be somewhere around the US$14.50 level.
And just as with gold, I favour the final pullback low to occur in May 2015.
SILVER MONTHLY CHART
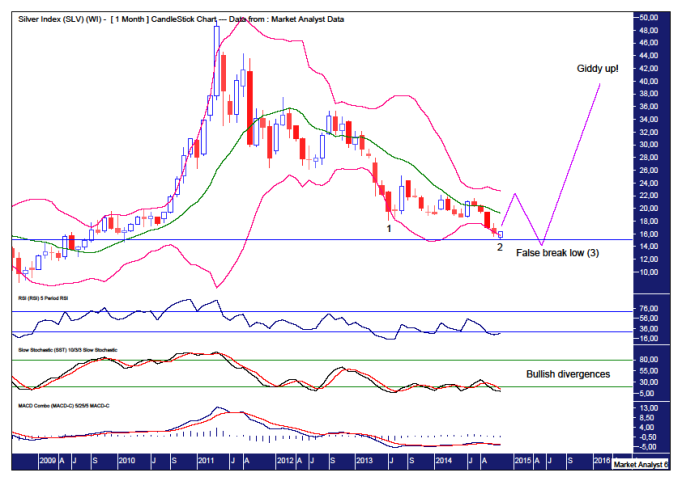
The lower Bollinger Bands was a great spot for price to find a low. I’m now looking for a rally up to the upper band which currently stands above US$22.70. Price may fall just short.
The RSI, Stochastic and MACD indicators are all showing bullish divergences so more solid evidence that a good rally can be expected.
Just as with gold, silver also has a “three strikes and you’re out” low formation in play. The difference being its second low is much lower than the first low. Therefore, I favour the third and final low be only marginally lower than the second low. A false break low if my analysis is correct.
Once that low is in then it will be giddy up for the bucking bulls!
Let’s wrap it up voodoo style with the yearly chart.
SILVER YEARLY CHART
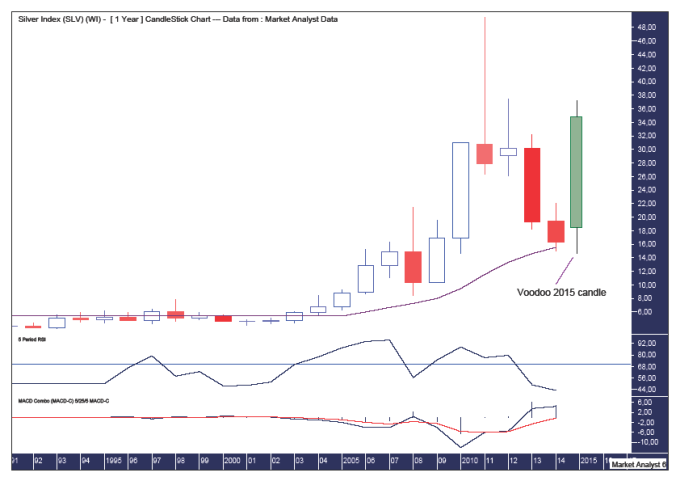
Price is already down around the the 14 period moving average level. That demonstrates the weakness of silver compared to gold.
However, I expect silver to turn the tables next year and outperform gold. That can be seen in the Voodoo 2015 candle which is very bullish. I’m basically looking for silver to double in price from low to high next year. And I expect new all-time highs to be made in 2016.
While it has been frustrating waiting for this rally in gold and silver to kick off, the wait is now over…and the Voodoo is kicking into gear!
********
My website is www.thevoodooanalyst.com
© 2014 Copyright The Voodoo Analyst - All Rights Reserved
Disclaimer: The above is a matter of opinion provided for general information purposes only and is not intended as investment advice. Information and analysis above are derived from sources and utilising methods believed to be reliable, but we cannot accept responsibility for any losses you may incur as a result of this analysis. Individuals should consult with their personal financial advisors. Put simply, it is JUST MY OPINION.


