The Gold-Silver Opposites Report


 Well, that was interesting. Gold went down over thirty bucks and silver went up over thirty cents. How much longer can this silver rally continue in the face of gold’s nonparticipation? Will speculators really be comfortable bidding silver up to $20 while gold sits at $1200? Do the fundamentals support a higher silver price?
How is silver different from gold? Aside from being a lot cheaper per ounce, and that an ounce of silver is almost twice as bulky as an ounce of gold.
There are two differences. One is that Silver has industrial demand. While virtually every ounce of gold ever mined in history is still in human hands, some silver is consumed. Gold is too expensive to put into most products except in minute quantities (though it’s in the iPhone). Most of what goes into electronics is recycled, as circuit boards are equivalent to good ore. As industrial demand falls (witness the collapse in the price of shipping), this component of silver demand falls with it. Smartphone sales may be strong, but silver is used in everything from cars to washing machines. The drop in industrial demand is surely the main culprit in the rise in the gold-silver ratio, predicted and chronicled in this Report for years.
The other is that silver is more the money of the people. If you work for wages and want to set aside something out of your weekly paycheck, with silver you can get a big coin or two. This is metal you can heft. With gold, it would either be a tiny wafer and for this, you would pay a huge manufacturing premium. Or else it would be a digital gold credit in an account, which may not have the same satisfaction (or risks) as metal in your hand. It is this sort of demand that has been anemic in both metals for years (notwithstanding demand for certain silver coins).
For now, people are content to be creditors to the government and the banks (or else don’t really understand what it means to hold dollars).
When this demand returns in earnest, we don’t think it will be in silver only. When the next wave of dollarphobia returns, it will likely drive people into both metals. If it turns out to be only one metal, then it will not be silver.
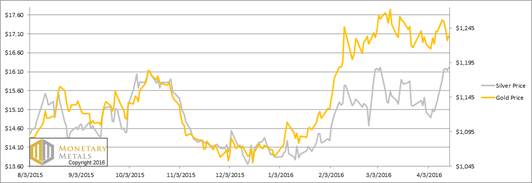
Let’s look at the only true picture of supply and demand fundamentals. But first, here’s the graph of the metals’ prices.
The Prices of Gold and Silver
Next, this is a graph of the gold price measured in silver, otherwise known as the gold to silver ratio. The ratio was down 6% this week.
The Ratio of the Gold Price to the Silver Price

For each metal, we will look at a graph of the basis and cobasis overlaid with the price of the dollar in terms of the respective metal. It will make it easier to provide brief commentary. The dollar will be represented in green, the basis in blue and cobasis in red.
Here is the gold graph.
The Gold Basis and Cobasis and the Dollar Price

Look at that. The June gold contract is now offering 50 basis points (annualized) to anyone who wishes to carry it. That is, to buy gold and sell it forward.
This just about matches the two-month LIBOR rate, and is a marked change from the recent past.
What a change. Compare to the Report from 18 October. We showed a December gold basis of around -15 bps (which was then the same time to expiration). Or 14 February, with an April basis barely above zero. The last two months have seen a skyrocketing in gold. Not the price, but the basis.
We would not precisely say that gold is now abundant in the market, but we wouldn’t say it it’s scarce exactly either.
Our calculated gold fundamental price dropped $60 this week. It’s still $25 over the market price, but that’s hardly a significant difference. Gold is almost fairly priced today.
Now let’s turn to silver.
The Silver Basis and Cobasis and the Dollar Price

First, let’s note the dog that did not bark in the night. We have not yet had to switch from the May to July contracts. Normally, the unbridled selling of the contract before expiry causes the basis to fall off the bottom of the chart, and often temporary backwardation readings as well. So we are forced, generally before now, to switch to the next contract to get a good picture. Not so today. We still have a good signal that shows the market action clearly.
And what is that action? As price of silver rises (shown as a drop in the price of the dollar, measured in silver terms) the metal becomes less scarce.
Only a few short weeks ago, we were speculating on the possibility of the silver cobasis to rise above zero, called backwardation. But since then, the price has risen about a buck twenty.
Our calculated fundamental price did rise a bit this week, but it’s a buck twenty below the market price (not directly related to our comment about imminent May silver backwardation, but not entirely unrelated either).
© 2016 Monetary Metals
 Dr. Keith Weiner is the CEO of Monetary Metals and the president of the Gold Standard Institute USA. Keith is a leading authority in the areas of gold, money, and credit and has made important contributions to the development of trading techniques founded upon the analysis of bid-ask spreads. Keith is a sought after speaker and regularly writes on economics. He is an Objectivist, and has his PhD from the New Austrian School of Economics. His website is www.monetary-metals.com.
More from Gold-Eagle


