Gold To Silver Ratio Gives Silver Buy Signal…2016
 share
share
 share
share
 share
share
 share
share
 share
share
The gold to silver ratio has been used for years to indicate buy and sell zones in both gold and silver. Why?
- At BOTTOMS in both gold and silver, based on 40 years of history, silver prices have fallen farther and faster than gold. Hence the gold/silver ratio reaches a relative high.
- At tops in both gold and silver the ratio is often low since silver rises more rapidly than gold. As Jim Sinclair says, “silver is gold on steroids.”
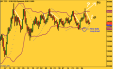
Examine the following graph of the gold to silver ratio (monthly data) for the past 40 years. I have circled the six most extreme highs in the ratio with green ovals.

At 5 of 6 extremes in the ratio silver was at or near a long term bottom. The one minor exception was when silver bottomed in November of 2001 at $4.01 and the ratio peaked later in May 2003. Otherwise the ratio was quite accurate at indicating major silver lows.
For more confirmation, assume a silver buy signal occurs when an extreme in the gold to silver ratio has been reached, and the weekly silver price closes above its 5 week moving average.
Monthly Ratio Extremes Silver (weekly) closes above
(green ovals above) 5 week MA
June 1982 July 2, 1982
August 1986 September 5, 1986
February 1991 March 8, 1991
May 2003 April 11, 2003
November 2008 November 28, 2008
February 2016 January 29, 2016
The six major highs in the gold to silver ratio are marked above with green ovals, and also marked below on the log scale chart of COMEX silver. Note that 5 of 6 price lows were accurately indicated by the ratio highs, with the November 2001 price low being a minor exception.
SO WHAT?
Using the above simple analysis, silver hit a multi-year low in December 2015 and has confirmed that low by closing above its 5 week moving average AND registering a gold to silver ratio slightly above 80, the highest in about 20 years and the most extreme peak since the 2008 crash lows in gold and silver prices.
Silver hit a low on December 14, 2015 at $13.61. The price on Feb. 24, as this is written, is $15.43, nearly $2 higher. Of course the paper silver market will flop around as it is managed by High Frequency Trading but the ratio provides more evidence that a silver bottom occurred about two months ago.
Note the logarithmic lines on the silver price chart. The lines are somewhat arbitrary but roughly represent a lower bound, a middle trend-line, and an upper blow-off line. The middle trend-line passes through $25 in 2016 and the red line shows that $50 silver is one good rally away. We will see $50 silver…perhaps in 2017.
Stacking silver makes sense – silver thrives and paper dies.
For more information on silver demonetization and possible future prices for silver, read my novel “Who Killed Doctor Silver Cartwheel?”
********
share
share
share
share
share
 Gary Christenson is the owner and writer for the popular and contrarian investment site Deviant Investor and the author of the book, “Gold Value and Gold Prices 1971 – 2021.” He is a retired accountant and business manager with 30 years of experience studying markets, investing, and trading. He writes about investing, gold, silver, the economy and central banking.
More from Gold-Eagle