Gold & Silver Review


Review:
- In my last analysis from 25th of july I wrote: "Swing traders need to be patient and avoid trading in this whipsaw environment. Scaling in with limit buy orders between US$1,281.00 and US$1,265.00 should be a promising recipe. Stopps should be placed below US$1,240.00."
- If you have followed my recommendation you should now hold a full Gold trading position according to your money management rules. The tricky part in the next couple of weeks will be to follow a trailing stopp strategy that keeps you in the market as long as possible.


Arguments for lower prices:
- 3-years downtrend: Overall Gold still is in a downtrend. US$1,525.00 remains the line in the sand. Gold will need much more time to break through this heavy resistance. Only a move above US$1,390.00 and especially US$1,430.00 will indicate that the mid- and longer-term trend indeed has changed. A sustainable move above US$1,320.00 would already brighten up the technical picture. I recommend reading this very good article about precious metals bear markets. Also the 8 year cycle for Gold should bring a significant low around 2015/2016. It could mean that this bear market has to continue for one or two more years. But we are very likely in the last quarter.
- Gold Monthly Chart: MACD sell signal active since november 2011 (this is extremely powerful and needs to change before one can really call the bottom). The MACD indicator is getting very close to a buy signal. On the 20-year chart you can see how low the MACD has fallen during the last 3 years and how huge the upside potential will be after the ongoing bear market is done.
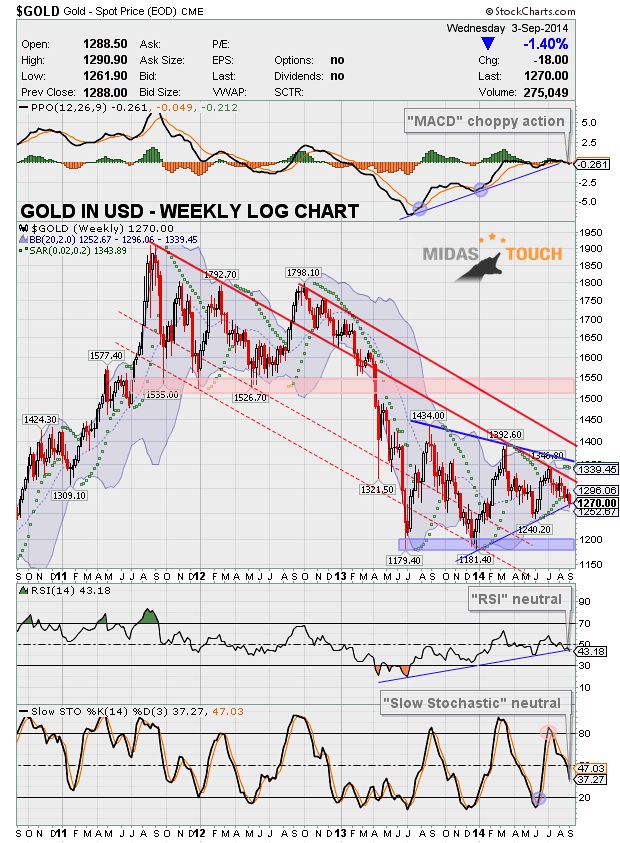
- Gold Weekly Chart: A series of lower highs and higher lows often leads to a symmetrical triangle formation. After failing to reach the blue triangle downtrend-line around US$1,365.00 in july Gold broke through the triangle uptrend-line at US$1,275.00 earlier this week. The move is not yet decisive but bears are in control. MACD is choppy while Stochastic and RSI are somewhat neutral. Overall Gold continues to move sideways as long as US$1,180.00 and US$1,430.00 are not taken out.
- Gold Daily Chart: Gold is in a correction since 13th of july and has lost nearly 6.3%. Gold is currently moving below the 200-MA (US$1,284.89) and the 50-MA (US$1,304.49). MACD sell signal active while Stochastic is oversold. RSI not yet oversold.
- Gold Stocks: HUI has been correcting sideways but the sentiment is still sitting at slightly too optimistic levels (60%). Generally gold stocks do not give the impression as if this correction is really done.
- CoT-Data: Latest commercial short position in Comex Gold Futures was 123,548 contracts. The numbers have improved but do not yet signal a lack of hedging activities by the smart money. CoT-Data for silver is neutral as well.
- Physical demand: Especially China´s Gold imports via Hongkong have been very weak. Without sufficient physical demand the paper gold market is in control.
- US-Dollar: Since early may the US-Dollar has posted a massive rally (+5.2%). The rally mainly was driven by a very weak Euro. So far the trend is strong and supported by embedded Stochastic. But the US-Dollar is getting very overbought and ripe for a correction.
- Gold/Silver Ratio: Currently at 66.13. Silver has been much weaker than Gold in the last 6 weeks. As well the ratio is not confirming the recovery since end of december.
- Volatility: The CBOE Gold Volatility Index is at low levels. A big move in Gold is brewing. The tightening range in the gold-market has lulled options market participants into a relative sense of complacency. Historically when the GVZ has fallen to such low levels a large move in Gold was not far away.
- Geopolitics: Although the situation in the Ukraine seems to escalate Gold has been moving lower and did not act as a safe haven.
Arguments for higher prices:
- Higher Low: The uptrend since the beginning of the year is still valid as long as US$1,240.20 is not taken out.
- Gold Monthly log-Chart: Longterm trend-line is still intact and now around US$1,260.00. Any move below US$1,250.00 would technically mean the end of this secular bull market! The MACD Indicator now is very close to create a powerful longterm buy signal.
- Gold Weekly Chart: Since May 2013 Gold is moving sideways between US$1,180.00 and US$1,434.00. Next support is the lower Bollinger Band (US1,252.67). If the blue triangle is still in play bulls could quickly gain back the lost territory.
- Gold Daily Chart: The former overbought situation has totally vaporized although on the daily chart Gold is not yet extremely oversold. The lower end of the downtrend channel has been reached on tuesday and wednesday. Both times Gold pushed higher and respected this crucial support. Stochastic needs to hold above 30 and push higher to create a sustainable buy signal.
- GLD: Open gap around $122.70 has been finally filled.
- Gold-Stocks: The HUI Gold Bugs Index has been holding up pretty well (basically moving sideways between 231 and 251 points since mid of june). The overbought situation has been completely neutralized. Gold stocks have been leading the sector higher since mid of last december.
- Sentiment: Short-term sentiment is slightly bullish as Gold has been selling off. I have received quite some emails from worried readers which is a good sign that we are close to a bottom. Longterm sentiment for Gold is still close to excessive pessimism.
- Seasonality: We are now in the best time of the year for precious metals. After 3 years with heavy corrections in autumn I think this year we could see a sustainable rally into december. Statistically best months of the year are august, september and november.
- Euro: According to the latest CoT-Data the commercials are holding the highest long position since july 2012. The sentiment for the Euro is terrible. There is quite some potential for disappointment during todays ECB meeting which could lead to a short squeeze and push the Euro higher. As the US-Dollar is now very overbought Gold should profit from a stronger Euro/weaker US-Dollar in the coming days and weeks. Also note that from mid of september seasonality for the Euro is explosive and tends to last into the final days of the year.
- Gold/Silver Ratio: The ratio did not confirm this week´s sell off. Silver is holding up well so far.
- India: The lower prices and the festival + wedding season seem to attract buyers. The premium which is a reliable indicator for higher gold prices has been rising from 0 to nearly US$25.00 during the last 2 weeks.
- CRB: The CRB Commodity Index is very oversold and ready for a bounce.
Conclusion:
- The correction in Gold has reached my target zone. It´s not extremely oversold but I think the next move will be to the upside. We could see more volatility in the coming two trading days and maybe another test US$1.258.00 - US$1.260.00 but after that a bounce and a recovery to at least US$1,280.00 - US$1,285.00 is to be expected. Also a massive short squeeze similar to the one in early june is quite possible. If Gold manages to regain the US$1,300.00 level I think the probability for a rally into end of the year are increasing significantly. In this case US$1,340.00 and US$1,390.00 will be the logical next targets.
- If instead Gold manages to only post a weak recovery and fails to regain the broken uptrend then the US$1,240.20 low from early june should soon be under attack and the door towards US$1,180.00 would be already wide open.
- Swing traders who followed my recommendation should now hold a full Gold trading position according to their personal money management & position sizing rules. I think you can still enter this swing trade below US$1,270.00. The stopp remains at US$1,240.20 for now and I will give my best to send out an update when there is a chance to move the stopp higher. In any case the stopp at US$1,240.20 has to be respected to protect your capital.
- Investors with a long-term perspective should have bought physical Gold below US$1,285.00 during the last two weeks. The next buy limit makes sense below US$1,240.00. Remember physical Gold is an insurance and will never get to zero. You´re just moving cash into a very safe conservative and liquid asset class that will protect you and your family.
Longterm:
- Nothing has changed
- Precious Metals bull market continues and is moving step by step closer to the final parabolic phase (could start now or within 1-2 years and last for 2-5 years or even longer)
- Price target DowJones/Gold Ratio ca. 1:1
- Price target Gold/Silver Ratio ca. 10:1
- My personal price target remains at US$5,000.00 to US$8,900.00 for Gold within the next 5-8 years
- Fundamentally, Gold should soon start the final 3rd phase of this long term bull market. 1st stage saw the miners closing their hedge books, the 2nd stage continuously presented us news about institutions and central banks buying or repatriating gold. The evolving 3rd and finally parabolic stage will end in the distribution to small inexperienced new investors who will be subject to blind greed and frenzied panic.
Personal note:
- I have been invited to speak at the Mines and Money London Conference on December the 3rd 2014. If you would like to join you can receive 25% off your delegate pass by using my discount code: ML875SPK.
 Florian Grummes (born 1975 in Munich) has been studying and trading the Gold market since 2003. In 2008 he started publishing a bi-weekly extensive gold analysis containing technical chart analysis as well as fundamental and sentiment analysis. Parallel to his trading business he is also a very creative & successful composer, songwriter and music producer. You can reach Florian at: [email protected].


