Is Gold Stock Mania About to Begin?


Economist Torsten Slok produced an interesting chart showing how the inflation cycle of today resembles that of the 1970s.
Slok, a Danish-American, is no slouch. Formerly with Deutsche Bank and now with Apollo Global Management, his charts are well-read around Wall Street. His market analysis earned him a profile in Bloomberg, and he was one of the first prominent voices to warn of a potential AI bubble in stocks this summer — warning how shares of Nvidia, Microsoft and eight other companies are creating an even bigger bubble than the one during the dot-com era.
Now Slok is warning of an “inflation mountain” in a potential repeat of the 1970s and ‘80s.
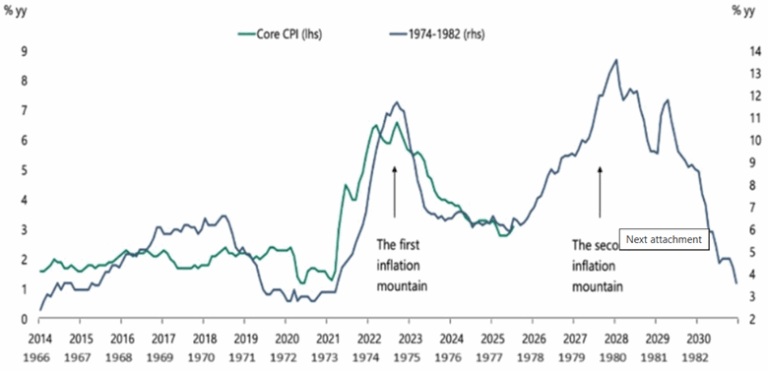
In the chart below, the core CPI (the price increase of goods and services minus food and fuel) is tracked over the period 1966 to 1982, on the X axis, and between 2014 and 2030. The Y axis on either side is the percentage increase in inflation, year on year.

Source: Apollo Global Management
Zooming out on the chart, we see “foothills” that are a near mirror image of each other from 1966 and 1973, and from 2014 to 2021. The rate of inflation never rises about 3.5% in either time period.
Now to the mountains. The first inflation mountain forms between 1973 and 1975, levels off for a couple of years, then a second mountain rises up between 1978 and 1982. Inflation reached a high point during this period of 14% in 1980.
It’s important to understand the difference between the green line, which represents inflation between 2014 and 2025, and the black line, which is 1970s and 1980s inflation.
What were the “policy missteps” that caused the second inflation mountain to form in the late 1970s, early ‘80s?
In the 1970s, the Fed cut interest rates too soon after an initial inflation spike, only to see prices surge again as oil shocks and wage demands rippled through the economy. That forced policymakers to slam rates back up, tipping the U.S. into repeated recessions and damaging the Fed’s credibility for years.
For Slok’s theory to be correct, inflation over the next five years would have to rise up and form a second mountain similar to the one between 1978 and 1982. More specifically, if the pattern holds, inflation would be due to scale another peak starting in the fall of 2025, i.e., now.
Also, for Slok to be right, the Fed would have to cut interest rates, as early as this month. This, in his view, is the policy mis-step that leads to the second mountain of rising inflation.
In his ‘Daily Sparks’ newsletter of Aug. 31, Slok noted inflation expectations from tariffs, dollar depreciation, and disagreement within the FOMC about how to balance rising inflation with slowing employment (the Fed has rarely cut rates against a backdrop of rising inflation).
The Fed is arguably bumbling into a similar policy mistake that they made in the 1970s, that of cutting rates too soon after an initial inflation spike — the July inflation print.
Let’s check back on our inflation mountain chart, I got the following from Munknee.com: ‘Check It Out: Gold Stock Manias in 79/80, 82/83 & 95/96 Saw 2,000 – 4,000% Returns – and It Could Happen Again (+5K Views)’.
Note the “Price On” date in the table below and then look at Apollo’s inflation mountain chart.
Gold and silver stocks clearly had a massive reaction to the mountain of inflation unleashed between 1978 and 1980.
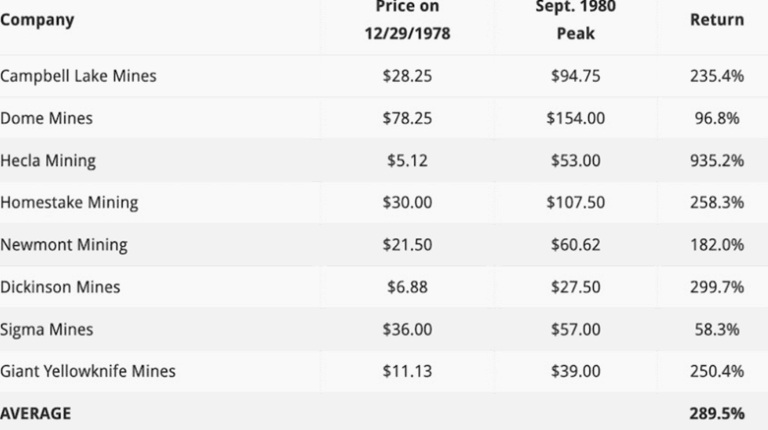
Average gold producers’ stock performance in ’79/’80 was 289.5%.
Source: Apollo Global Management
The gains were far more dramatic for the juniors during this period. The table below shows junior gold stock performance in 1979-80.
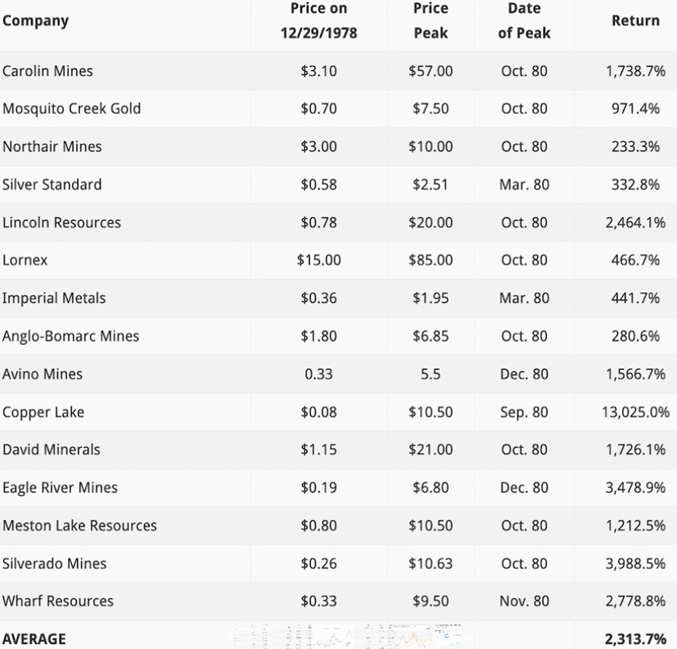
Junior gold stock performance in ’79/’80 was 2,313.7%.
Two more sets of tables are worth reproducing to prove Munknee’s point. The first set references the Hemlo rally of 1982-83. After Golden Sceptre and Goliath Gold discovered the Golden Giant deposit in the Hemlo gold camp of northwestern Ontario, a mini-bull market in gold stocks ensued.
As gold rallied from $309 an ounce in June 1982 to $475/oz in February 1983, the average return for gold producers between 1981 and 1983 was 72.5%.

While impressive, these returns were minor compared to the gold juniors, which averaged a whopping 4,081.8% during this period:

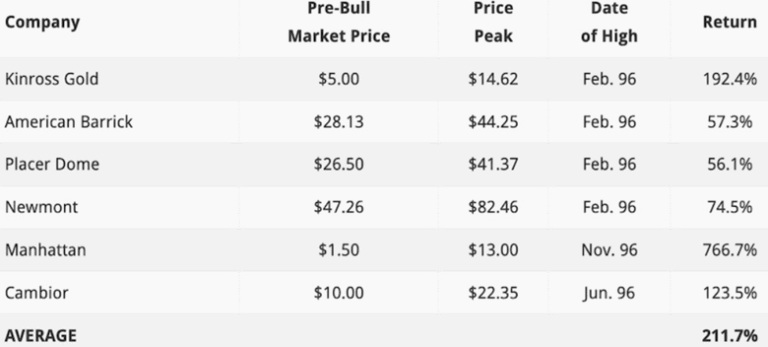
Another gold stock mania occurred in the summer of 1996. The same pattern emerges, with the gold juniors far outperforming the gold producers inside of just two years. The first table below shows the producers averaging 211.7%, while the juniors, almost all of them, achieved returns in the thousands of percent. From the lowest return, Golden Star’s 358.3%, to the highest return, Cartaway’s 26,040%, the average junior gold return during this period was 3,873%!

Conclusion
If the Fed carries through with an interest rate cut in September, and potentially two more cuts before the end of the year, amid rising inflation, a second inflation mountain similar to the one that grew between 1978 and 1982 could easily form between 2026 and 2028.
PPI and PCE data from July already show rising inflation, and another month of data from August is likely to show more inflation due to companies passing through their input cost increases from Donald Trump’s tariffs onto their customers.
The gold stock mania echoing the second inflation mountain in Apollo’s chart has just begun.
Here is our AOTH portfolio, the price the company shares traded at when introduced to our readers, and its current price as of market close on Sept. 5, 2025;
AGA 0.52/0.88
HVG 0.03/0.085
MAX 0.04/0.115
ORS 0.04/0.08
KDK 0.34/0.65
STRM Rollback 4:1 @0.05, 0.20/0.225
SNAG 0.085/0.25
GPH 0.66/0.72
RAK 0.28/0.88
WGO 0.35/0.64
BYN 0.24/0.70
MERC 0.135/0.135
TECT Rollback 10:[email protected], $0.50/$1.27
We’ve already had some gains, but we believe that we are going to see a lot more before this precious metals and commodities bull market is over.

If the employment situation worsens and inflation keeps climbing, look for economic growth to sputter as the US enters stagflation.
How has gold done during stagflation? As it turns out, quite well. The chart below by Sunshine Profits shows the gold price climbing during the stagflationary 1970s, surging from $100 per ounce in 1976 to around $650 in 1980, when CPI inflation topped out at 14%.
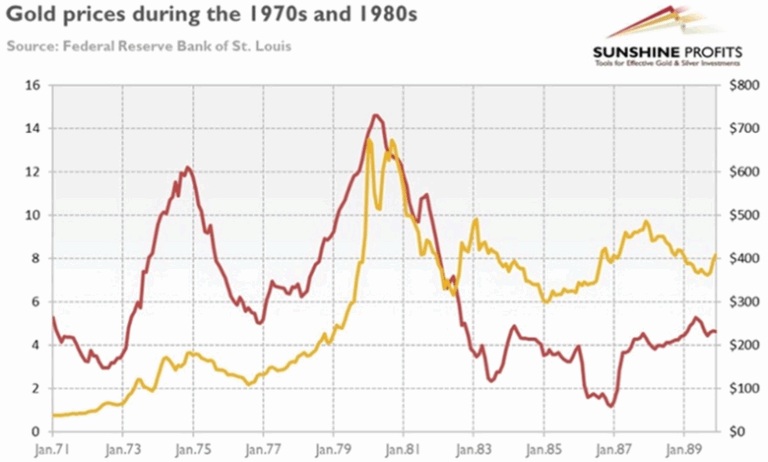
Gold prices in yellow compared to inflation in red.
Source: Sunshine Profits
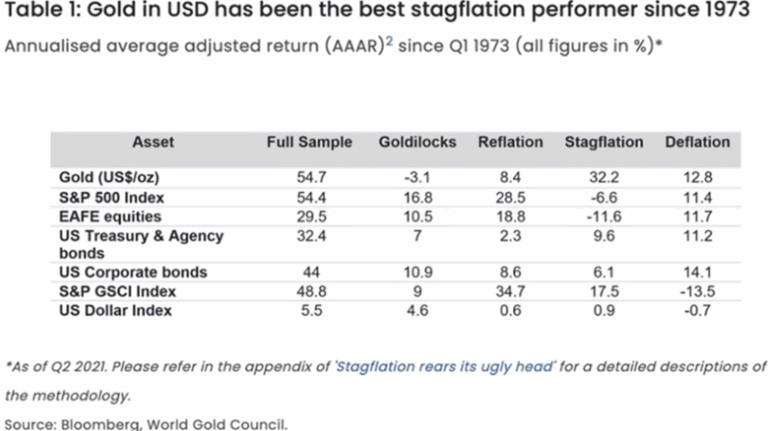
In fact, gold outperforms other asset classes during times of economic stagnation and higher prices. The table below shows that, of the four business cycle phases since 1973, stagflation is the most supportive of gold, and the worst for stocks, whose investors get squeezed by rising costs and falling revenues. Gold returned 32.2% during stagflation compared to 9.6% for US Treasury bonds and -11.6% for equities.
AOTH’s gold and silver stocks are safe if economic growth continues to slide and inflationary pressures worsen – precious metals do well when real interest rates turn negative. Bad economic news leads to precious metals being are an attractive alternative to stocks. Gold/ silver perform even better if the dollar weakens. Investors also like gold and silver when inflation is high; unlike fiat currencies, precious metals don’t lose their value.
Richard (Rick) Mills
aheadoftheherd.com
*********


