Gold Stocks…Still Struggling!


Charts created using Omega TradeStation 2000i. Chart data supplied by Dial Data
Despite some improvement from their November/December 2014 lows, gold stocks remain depressed. I use the word depressed because that is the only way one can describe it even though the gold stocks as represented by the Gold Bugs Index (HUI) are up a stellar 28% since those lows. One is always reminded that the HUI remains down 70% from the highs of 2011 -- even if one would like to forget that fact. For the record, the TSX Gold Index (TGD) is up over 39% from its November low but remains down 60% from its 2011 highs. The relative stronger performance of the TGD to the HUI is most likely due to the decline of the Cdn$ during that period.
So is the current move just the gold stocks trying to show some signs of life or is it just another in a series of “let’s get the gold people excited so that they can be slammed again”. I would like to presume the former but there is always the fear that it might be the latter. The trouble with the up move for the gold stocks and for gold itself is that there is no confirmation that a bottom has been made. That leaves open that window of doubt that new lows could lie ahead.
That is the fear factor. There is the old saying from the Sage of Omaha, Warren Buffet that one should be “fearful when others are greedy and greedy when others are fearful”. For gold and gold stocks, most have been fearful. Sentiment towards both gold and gold stocks remains barely off their lows despite the recent rally.
So how fearful is fearful? At current levels, the HUI is trading where gold was back in 2008 at $725. However, it gets even worse. The HUI is trading at the same level it was at back in 2005 when gold was trading around $420. Gold today, even though depressed itself and down $700 from its 2011 highs is still at $1,220. The HUI should be near 320 based on the 2008 levels or near 550 based on the 2005 levels. If the market is fearful about gold, it is downright petrified about gold stocks.
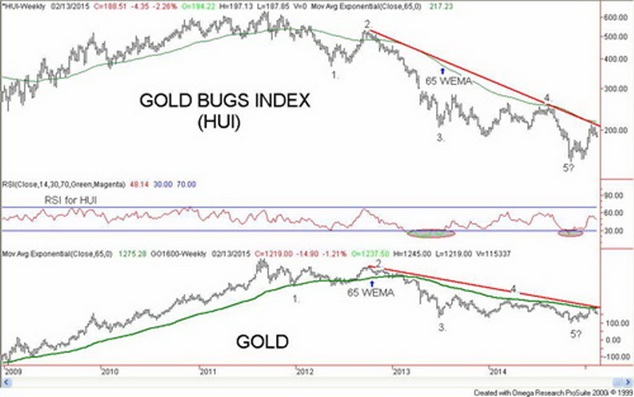
Since the highs of 2011, both the HUI and gold appear to have fallen in five distinct waves. The rise thus far from that low is inconclusive. So far, it appears as if three waves up have occurred. Impulse waves unfold in fives while corrective waves unfold in threes. If this is truly a corrective wave then potentially new lows lie ahead for both gold and gold stocks. If, however, an impulse wave to the upside is developing then both gold and the HUI should find support and resume their upward movement.
The weekly chart of the HUI and gold is shown with the 65-week exponential moving average (EMA). The major difference between a simple moving average (SMA) and an EMA is the EMA reduces lag and gives more weight to recent prices while the SMA calculates the average price over a specific number of periods. Since the long decline got underway in 2011 the 65 week EMA has acted as firm resistance for both gold and the HUI. The recent rise appears to be failing once again at or just under the 65 week EMA.
Confirmation cannot come that a significant bottom might be in until both gold and the HUI at minimum take out their wave 4 high. For the HUI that could come in a move above 250/260. For gold, it would require a move at least above $1,380 but preferably $1,430. Ideally, one would also like to see gold and the HUI regain their breakdown line. For gold that would be a move above $1,525 and for the HUI that would be a move above 400.
How would one know that the waves that have unfolded since the November low are corrective only? The recent highs for gold at $1,303 and for the HUI at 211 should not be broken. For gold, a breakdown under $1,170 would suggest that new lows could lie ahead. How low could gold go? Potential objectives could be down to $960. For the HUI a breakdown under 180 may be of concern but the reality is that only a breakdown under 160 would suggest new lows below 146. In theory, the HUI could fall to potential objectives near 80 if new lows are seen under 146. Realistically, however, that is highly unlikely as that could imply that the gold sector was imploding with bankruptcies.
While the bearish scenario is possible hope as they say always springs eternal and a somewhat more bullish scenario could develop. First it is important that levels noted above hold. Those levels are seen at $1,170 for gold and 160 for the HUI. Preferably, even $1,200 holds for gold and 180 holds for the HUI. Second new highs above 211 for the HUI and above $1,303 for gold are essential. Regaining 200 for the HUI and $1,280 for gold would go some distance to suggest that those levels could be taken out.
If the November low was truly the three year cycle low then the current rebound should not top until at minimum March and as late as November. A move to new highs for both the HUI and gold could suggest a move by the HUI to as high as 300 and for gold up to $1,350 to $1,380. Volumes were quite good on the recent up move that topped in January while volumes on this pullback have been sharply lower. Lower volumes are more suggestive of a corrective move. Gold and gold stocks sentiment improved somewhat on the recent rally,but has sagged on this pullback.
Prior to this pull back, it was noted that the commercial COT fell suggesting that the commercials were getting short. The bullion banks are considered a part of the commercials along with the gold mining companies. It is a strange combination given that the gold miners interest is hedging their positions while the bullion banks are well known to speculate. While some strong paper gold selling has been seen it has not been overwhelming as was seen in 2013.
On the physical side, demand remains strong even as 2014 demand slipped 4% from 2013. The World Gold Council has just released its 2014 report and highlights were as follows: jewellery demand fell 10% but remained above the 5-year average; investment demand rose 2% but sentiment was muted and ETF outflows fell; technology demand slipped; but central bank purchases jumped 17% in 2014 against insignificant sales. Overall supply was static even as mine production grew by 2% but recycled gold fell to a 7 year low.
Demand in 2015 so far has remained robust as there have been signs of heavy purchasing of gold in Greece as a safe haven in the event of the “Grexit”. As well, Chinese demand has picked up a little in advance of the Chinese Lunar New Year. It was also rumoured that Russia continued to purchase gold in January even against the backdrop of the declining Ruble, sanctions and supposedly their economy imploding.
Recent actions by central banks are suggestive that the central banks are losing control. Over the past month or so there was first the shock of the Swiss National Bank (SNB) and its sudden unpegging of the Swiss Franc from the Euro. This was followed by the Bank of Canada’s (BofC) unexpected cutting of the bank rate by 0.25%. Finally, there was the size of the ECB’s QE program despite the objections of Germany.
But the sharp drop in gold prices was driven by the higher than expected US nonfarm payrolls released on February 6, 2014. This seemed to trigger an excuse to sell even as the headline unemployment rate actually ticked higher. The relatively stronger US economy seems to take precedence over the Japan and the Euro zone falling into recession and the slowing Chinese economy. As well there remains fear that the Fed will hike interest rates sometime later in 2015. All of this has helped drive the US$ to its highest levels since 2003. A rising US$ is normally negative for gold prices quoted in US$ even as gold has been rising in a host of other currencies.
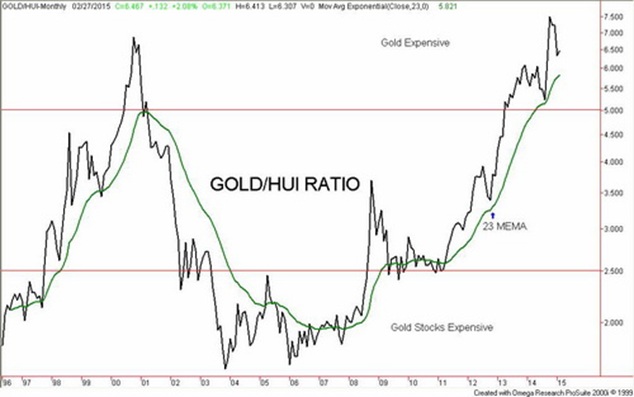
There is one more chart that demonstrates why the gold stocks could continue to outperform bullion itself. The Gold/HUI ratio has only recently come down from its highest levels since 2000. The 2000 high for the Gold/HUI ratio came when gold was hovering between $250 and $300 while the HUI actually fell under 50. The current sentiment for gold stocks is not unlike what was seen in 2000 when mentioning the word gold stock was liable to bring one “death stares”. Despite the recent improvement for both gold and gold stocks “death stares”, remain in vogue. Of course, in 2000 it was also the time to buy gold stocks and gold as well. As the saying goes, be greedy when others are fearful.
Charts created using Omega TradeStation 2000i. Chart data supplied by Dial Data
Copyright 2015 All rights reserved David Chapman
General Disclosures
The information and opinions contained in this report were prepared by Industrial Alliance Securities Inc. (‘IA Securities’). IA Securities is subsidiary of Industrial Alliance Insurance and Financial Services Inc. (‘Industrial Alliance’). Industrial Alliance is a TSX Exchange listed company and as such, IA Securities is an affiliate of Industrial Alliance. The opinions, estimates and projections contained in this report are those of IA Securities as of the date of this report and are subject to change without notice. IA Securities endeavours to ensure that the contents have been compiled or derived from sources that we believe to be reliable and contain information and opinions that are accurate and complete. However, IA Securities makes no representations or warranty, express or implied, in respect thereof, takes no responsibility for any errors and omissions contained herein and accepts no liability whatsoever for any loss arising from any use of, or reliance on, this report or its contents. Information may be available to IA Securities that is not reflected in this report. This report is not to be construed as an offer or solicitation to buy or sell any security. The reader should not rely solely on this report in evaluating whether or not to buy or sell securities of the subject company.
Definitions
“Technical Strategist” means any partner, director, officer, employee or agent of IA Securities who is held out to the public as a strategist or whose responsibilities to IA Securities include the preparation of any written technical market report for distribution to clients or prospective clients of IA Securities which does not include a recommendation with respect to a security.
“Technical Market Report” means any written or electronic communication that IA Securities has distributed or will distribute to its clients or the general public, which contains an strategist’s comments concerning current market technical indicators.
Conflicts of Interest
The technical strategist and or associates who prepared this report are compensated based upon (among other factors) the overall profitability of IA Securities, which may include the profitability of investment banking and related services. In the normal course of its business, IA Securities may provide financial advisory services for issuers. IA Securities will include any further issuer related disclosures as needed.
Technical Strategists Certification
Each IA Securities technical strategist whose name appears on the front page of this technical market report hereby certifies that (i) the opinions expressed in the technical market report accurately reflect the technical strategist’s personal views about the marketplace and are the subject of this report and all strategies mentioned in this report that are covered by such technical strategist and (ii) no part of the technical strategist’s compensation was, is, or will be directly or indirectly, related to the specific views expressed by such technical strategies in this report.
Technical Strategists Trading
IA Securities permits technical strategists to own and trade in the securities and or the derivatives of the sectors discussed herein.
Dissemination of Reports
IA Securities uses its best efforts to disseminate its technical market reports to all clients who are entitled to receive the firm’s technical market reports, contemporaneously on a timely and effective basis in electronic form, via fax or mail. Selected technical market reports may also be posted on the IA Securities website and davidchapman.com.
For Canadian Residents: This report has been approved by IA Securities, which accepts responsibility for this report and its dissemination in Canada. Canadian clients wishing to effect transactions should do so through a qualified salesperson of IA Securities in their particular jurisdiction where their IA is licensed.
For US Residents: This report is not intended for distribution in the United States.
Intellectual Property Notice
The materials contained herein are protected by copyright, trademark and other forms of proprietary rights and are owned or controlled by IA Securities or the party credited as the provider of the information.
Regulatory
IA Securities is a member of the Canadian Investor Protection Fund (‘CIPF’) and the Investment Industry Regulatory Organization of Canada (‘IIROC’).
Copyright
All rights reserved. All material presented in this document may not be reproduced in whole or in part, or further published or distributed or referred to in any manner whatsoever, nor may the information, opinions or conclusions contained in it be referred to without in each case the prior express written consent of IA Securities Inc.

David Chapman regularly writes articles of interest for the investing public. David has over 40 years of experience as an authority on finance and investments via his range of work experience and in-depth market knowledge.


