Gold Stocks: Correction Or Final Push Higher?


Despite maintaining an overbought condition and despite the recent bearish posture of many sector pundits, the gold stocks have yet to correct more than 11%. Since the end of January, the gold stocks have held above their 50-day moving averages, which is often supported during a strong trend. If the gold stocks break their lows of the past two weeks then it should usher in a 20% correction and correct the current overbought condition. However, if gold stocks do not break initial support they could begin a melt-up that would lead to a more serious correction in the summer.
The chart below plots the three major rebounds in the HUI from the three most significant lows. The time and price scale begins from where the current rebound started. At this juncture, the two other rebounds corrected at least 20%. The current rebound has tracked the 2008 rebound very closely. That bull endured two 20% corrections over the next few months which proved to be good buying opportunities.

HUI Daily Chart
HUI Bull Analogs
If the gold stocks do not break initial support and correct more, they would be at risk of a deeper correction following another push higher. The following chart is ARCA Gold Miners, the parent index for VanEck Vectors Gold Miners (NYSE:GDX). Unlike GDX, GDM has a history that dates back to 1993. GDM closed Thursday at 684. It has a major resistance target at 800-810. A move to 800 is 17% upside while a move to 810 equates to GDX 29.
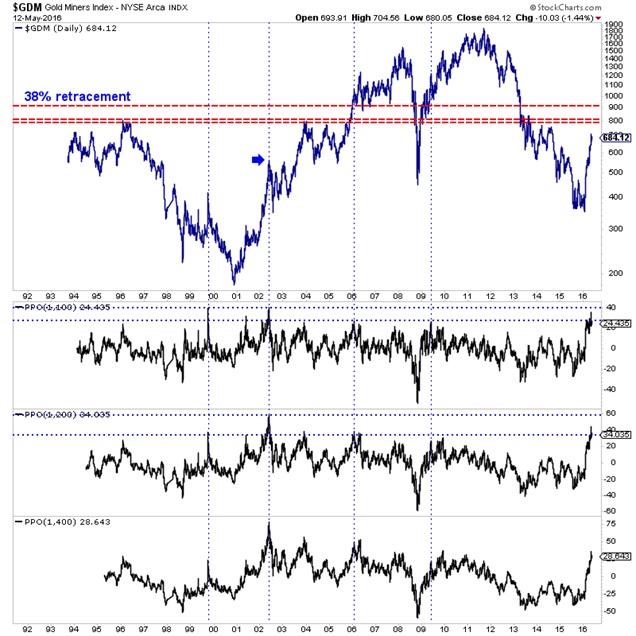
GDM Daily Chart
GDM Daily
Also, note the three oscillators at the bottom of the chart which plot GDM’s distance from its 100-day, 200-day and 400-day exponential moving averages. The gold stocks are not as overbought as they were in 2002 but they are more overbought than at any other time in the past 23 years. That is a good sign considering we are early in a new bull market but it does warn of a probable sharp correction.
The support and resistance for GDX and VanEck Vectors Junior Gold Miners (NYSE:GDXJ) continue to be clear. GDXJ has support at $32-$33 with upside targets at $43-$45 and $50. Meanwhile, GDX has support around $22 with upside targets at $27-$28 and $30. A final push higher (before a correction) could take GDX to $29-$30 and GDXJ to $45.
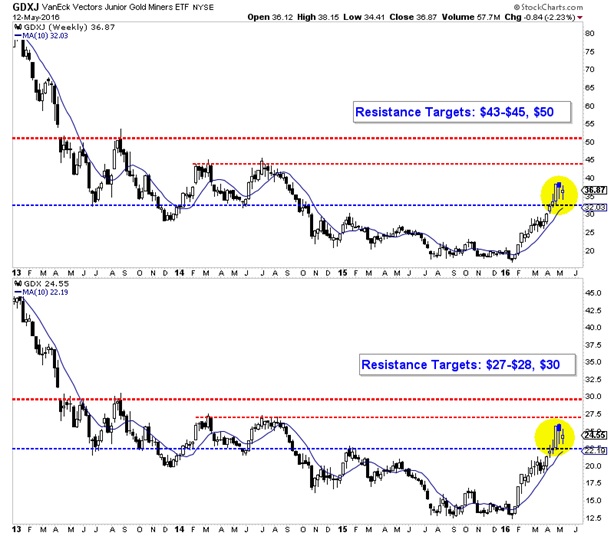
GDXJ Weekly Chart
GDXJ and GDX
The past few months has been an amazing ride in the gold stocks but all good things come to an end. Unless the gold stocks break initial support and correct by 20% (from recent peaks) then the risk of a final push higher or melt-up type move increases. That is great for us bulls but the problem is it would likely lead to a 30% correction and a potential multi-month consolidation during the second half of 2016.
********
Jordan Roy-Byrne, CMT

Jordan Roy-Byrne, CMT is a Chartered Market Technician and member of the Market Technicians Association. He is the publisher and editor of TheDailyGold Premium, a publication which emphasizes market timing and stock selection, as well as TheDailyGold Global, an add-on service for subscribers which covers global capital markets. He is also the author of the 2015 book, The Coming Renewal of Gold’s Secular Bull Market which is available for free. TheDailyGold.com was recently named one of the top 50 Investment Blogs by DailyReckoning and WalletHub.


