Gold/Palladium Ratio


Just behind the podium of precious metals (occupied by gold, silver and platinum) is palladium - an important, but often overlooked investment commodity. Like in case of silver and platinum, the gold-to-palladium ratio indicates the current state of the precious metals market. Investors may benefit from watching a ratio, as it helps to determine the strength of gold compared to palladium. Technically, the number is the price of gold divided by the price of palladium. It shows how many ounces of palladium one ounce of gold can buy.
Let's analyze the chart below, which shows changes in the gold-to-palladium ratio in the long run (for the years 1977-2002 we use gold and palladium futures prices, while for years 2003-2016 we use London fix prices both for gold and palladium, due to incomplete dataset of Nymex palladium futures prices).
Chart 1: The gold-to-palladium ratio (the price of gold divided by the price of palladium, red line, right axis), the price of gold (yellow line, left axis, COMEX gold futures and London A.M. Fix) and the price of palladium (blue line, left axis, NYMEX palladium futures and London fix) from 1977 to May 12, 2016.
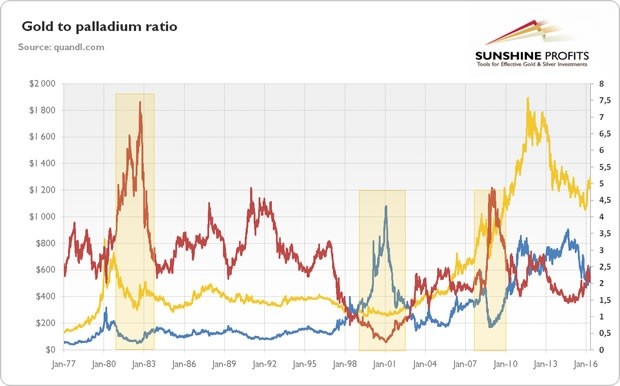
As one can see, the dynamics of the gold-to-palladium ratio are quite similar to the behavior of the gold-to-platinum ratio. It should not be surprising, because palladium is also used in the automotive industry and can be regarded as a cheaper substitute of platinum. Indeed, the ratio was generally in the upward trend in the 1970s, as there was a bull market in gold. It peaked in October 1982, reaching around 7. It implies that gold was overvalued relative to palladium, or that the latter was relatively cheap compared to the former. During the bear market in gold, the indicator fell into a secular downward trend, bottoming around 0.24 in January 2001. It was a 96.6-percent decline, signaling a significant overvaluation of palladium, which skyrocketed at the end of the 20thcentury due to disruptions of the supply (there were rumors that Russia would cease its sales of palladium) and intense demand from the automobile industry. The price of palladium reached an all-time height of almost $1,100, a level more than four times higher than the price of gold. Thereafter, the ratio started to rise again, but it surged in December 2008, reaching almost 4.9 after the outburst of the financial crisis. The jump in the gold-to-palladium ratio clearly shows that gold is mainly a safe haven asset, while palladium is an industrial metal. Then, it declined to around 1.42 in September 2014, as palladium prices performed better than gold prices due to a constricted supply of the former metal and relatively high confidence in the global economy. Consequently, gold was relatively undervalued then compared to palladium. However, the ratio has been rising since then, as palladium underperformed gold. It signals an increased risk premium demanded by investors and a reduced trust in the current financial system based on the government-sponsored fiat money.
What can we learn from the analysis of the historical developments of the gold-to-palladium ratio? Well, as we said, the general pattern is quite similar to the case of the gold-to-platinum ratio. It was rising during boom in the gold market in the 1970s and 2000s, and was declining during the 1980s and the 1990s, peaking in 1982 and 2008, while bottoming out in 2001. However, there are two important differences. First, the gold-to-palladium ratio is much more volatile, as palladium is the most industrially significant among main precious metals (industry generates more than 70 percent of the demand for palladium). The ratio ranged from 0.24 to 7, with a general average of 2.6 and the average range between 1.9 and 3.2. Therefore, if the ratio moves to extremes (let's say, above 4 or below 1.5), it creates a trading opportunity for investors. When the ratio is high, it indicates that palladium may be oversold and present a buying occasion. And when the ratio is low, it means that palladium may be overbought and reflect a selling opportunity. Second, contrary to the case of platinum, the number of palladium ounces which may be purchased by an ounce of gold has decreased since 2008 and has rebounded only recently. This is because palladium has outperformed platinum since 2009, with the platinum-to-palladium ratio bottoming only at the turn of September and October 2015. It is another signal (along with the unusual high gold-to-platinum ratio) that platinum may be undervalued.
********
Arkadiusz Sieron
Sunshine Profits‘ Gold News Monitor and Market Overview Editor

Arkadiusz Sieroń received his Ph.D. in economics in 2016 (his doctoral thesis was about Cantillon effects), and has been an assistant professor at the Institute of Economic Sciences at the University of Wrocław since 2017. He is a board member of the Polish Mises Institute of Economic Education, author of several dozen scientific publications (including in such periodicals as the Journal of Risk Research, Prague Economic Papers, Quarterly Journal of Austrian Economics, and Research in Economics), and a regular contributor to GoldPriceForecast.com and SilverPriceForecast.com. His two books, Money, Inflation and Business Cycles and Monetary Policy after the Great Recession, are both published by Routledge. Arkadiusz is also a certified Investment Adviser, a long-time precious metals market enthusiast, and a free market advocate who believes in the power of peaceful and voluntary cooperation of people.


