The Great Paper Ponzi: Global Mutual Fund Inflows vs Physical Gold Investment


As the highly leveraged global financial system moves closer towards an epic collapse, investors unwittingly continue to pour money into the Mutual Fund Market. According to the ICI – Investment Company Institute’s Q3 2014 Report, net inflows into Mutual Funds Worldwide during the third quarter reached $320 billion, up from $285 billion in Q2 2014.
Furthermore, bond funds took first place as investors parked $104 billion of the total $320 during Q3 in assorted mutual bond fund paper garbage. The table below from the ICI Q3 2014 Worldwide Mutual Fund Report shows the net flows into the global mutual fund market:
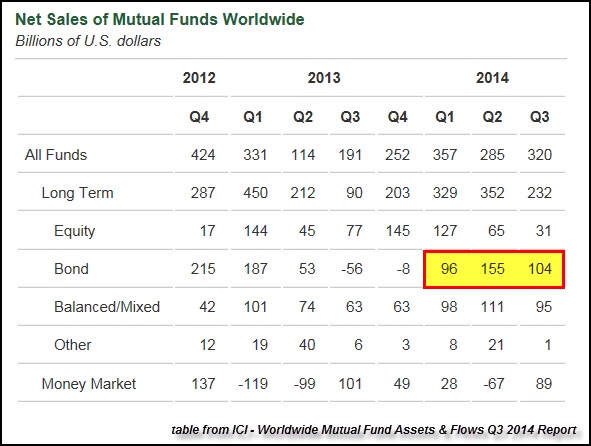
As we can see from the table above, during Q3 2014, investors purchased $104 billion of bond funds, $95 billion in balanced/mixed funds (bond-equity-money market), $89 billion in money market funds, $31 billion in equity funds and $1 billion in the other category.
You will notice a change in the last two quarters as investors flocked into bond funds (Q2 = $155 billion, Q3 = $104 billion), compared to the previous two quarters when equity funds (Q4 2013 = $145 billion, Q1 2014 = $127 billion) were more in fashion.
Deluded Investors Continue To Choose Paper 97% More Over Physical Gold
If we add up the total amount of net inflows for Q1-Q3 2014, investors dumped $962 billion into the worldwide mutual fund black hole market. Now, compare that to the paltry $33 billion invested in physical gold… according to the World Gold Council figures (note: I realize the WGC gold investment figures may be understated, especially in China):
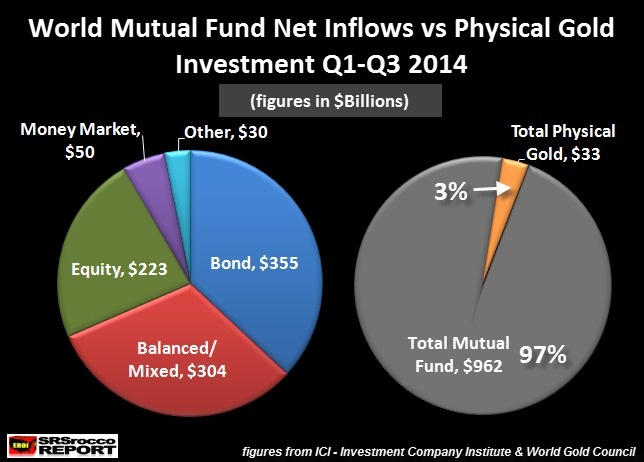
The majority of investor money went into bond funds at $355 billion, followed by balanced/mixed funds $304 billion, equity funds $223 billion, money market funds $50 billion and other funds at $30 billion. The World Gold Council stated global physical gold demand was $11.7 billion Q1, $11 billion Q2 and $10.1 billion in Q3 for a total of $33 billion.
Thus, total global physical gold investment of $33 billion was 3% in the first nine months of 2014 compared to the $962 of worldwide mutual fund net inflows. And of course, that 3% of physical gold investment is heavily skewed towards the Eastern Countries that comprise the lowest percentage of mutual fund investment.
Here is the breakdown of total Global Mutual Fund Assets as of Q3 2014:
Americas = 57%
Europe = 31%
Asia = 12%
Of the total outstanding worldwide mutual fund assets, the top award goes to the Americas at 57%, followed by Europe at 31% and Asia at 12%. Now compare this to the countries and regions that purchased physical gold in the first nine months of 2014:
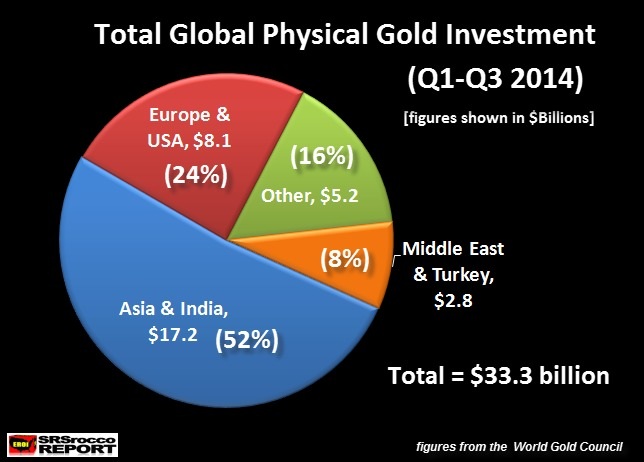
Of the reported $33 billion in global physical gold investment during Q1-Q3, India & Asia came in first with $17.2 billion (52%), followed by Europe & USA at $8.1 billion (24%), Other at $5.2 billion (16%) and the Middle East & Turkey last at $2.8 billion (8%).
Now, the America’s and Europe consisted of 88% of the total worldwide mutual fund investment pie, while Asia consisted of only 12%. On the other hand, Asia and India purchased 52% of global physical gold investment during Q1-Q3 2014 compared to Europe and the U.S. investing in 24% of the total.
Please understand, I am comparing the total worldwide mutual fund asset value as of Q3 2014 to the global physical gold investment purchases over the past nine months. I just wanted to give a frame of reference between the investment activities of the West and East.
Of course, some of that “other category” of 16% of the global physical gold investment pie may include Mexican and Canadian gold investment, but I doubt it would change the European and United States percentage all that much.
So, the take away is this…. smart Asians and Indians continue to trade in fiat money to purchase REAL ASSETS while Europeans and Americans forge blindly ahead into the GREAT MUTUAL FUND PAPER BLACK HOLE.
Mutual Fund Net Inflows Explode Over Past Three Years
It doesn’t take much to delude “Western Investors” these days. The evidence is shown by the massive increase of mutual fund inflows over the past three years. However, you wouldn’t know this was the case if we looked at the data for 2011. In 2011, worldwide mutual fund net inflows were a measly $103 billion, compared to the $320 billion invested in just Q3 2014.
If we take a look at the chart below, we can see the huge increase of mutual fund net flows since 2011:

Not only did inflows into mutual funds worldwide pick up in 2012 over 2011, they did so in glorious style… a staggering 781% annual increase. Investors dumped $908 billion into mutual funds in 2011 compared to the $103 billion in 2011. Then net inflows in 2013 continued to be strong even though they were down a bit to $888 billion.
However, 2014 is turning out to be one hell of a year for Wall Street and the other Brokerage and Banking Crooks in Europe as total net mutual fund inflows for Q1-Q3 2014 are already $962 billion, more than 2012 and 2013 already…. and we still have Q4 remaining.
What is interesting about the chart above is the comparison of global physical gold investment to worldwide mutual fund flows. In 2010, total global physical gold investment was $44 billion compared to $205 billion in worldwide mutual funds. Thus, global gold investment was 19% of these two asset classes.
Then as gold hit a new high of $1,900 in 2011, total global physical gold investment reached $77 billion compared to $103 billion in net worldwide mutual fund flows. 2011 was a record year for the gold market as it represented 43% of the total investment in these two asset classes.
Unfortunately for precious metal investors, the Fed’s QE policy greatly impacted paper assets more favorable than gold in 2012, 2013 and 2014. As I stated above, the worldwide mutual fund market swindled 97% of investors fiat money in the first nine months of 2014.
The real question is this… how long will the Global Mutual Fund Black Hole continue to suck in the world’s wealth? Well, that’s hard to tell, but the nifty chart below might offer us a clue:
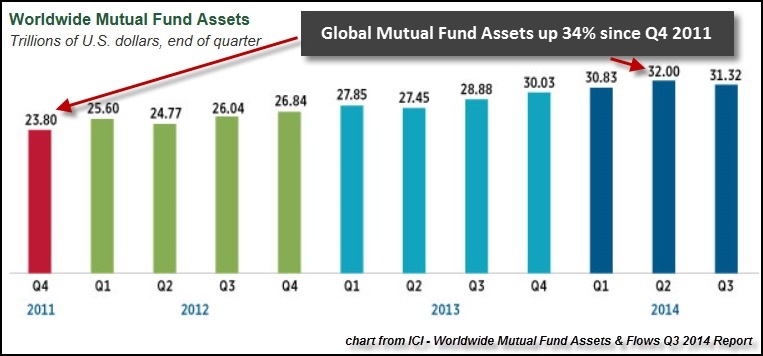
In less than three years, worldwide mutual fund assets increased 34% from $23.8 billion in Q4 2011, to a peak of $32 billion in Q2 2014. The reason for the decline in total mutual fund assets in Q3 ($31.3 billion) was due to the rapid appreciation of the Dollar. This had a negative impact on the value of mutual funds stated in various foreign currencies.
I highly doubt the 34% increase in worldwide mutual fund asset value since the end of 2011 is sustainable. At some point, the forces of gravity will overtake the highly leverage financial market with surprising speed. Regardless, this will impact Western investors a great deal more than the fundamentally grounded investors in the East.
The two important factors to highlight from this data:
1) Asia has the smallest percentage invested in the Mutual Fund Black Hole.
2) Asia & India continue to invest more than half of global physical gold investment pie.
North Americans and Europeans continue to overwhelmingly favor PAPER IOU’s compared to their Asian and Indian counterparts who enjoy buying and holding physical assets such as GOLD. While the West believes it has the UPPER HAND in the great game of FINANCE… the EAST will most definitely have the LAST LAUGH.
Please check back for new articles and updates at the SRSrocco Report. You can also follow us at Twitter below:


Independent researcher Steve St. Angelo (SRSrocco) started to invest in precious metals in 2002. Later on in 2008, he began researching areas of the gold and silver market that, curiously, the majority of the precious metal analyst community have left unexplored. These areas include how energy and the falling EROI – Energy Returned On Invested – stand to impact the mining industry, precious metals, paper assets, and the overall economy. He has written scholarly articles in some of the top precious metals and financial websites. Visit his website SRSrocco Report.


