
Happy Mid-Year Finds Gold Up a Gear
 share
share
 share
share
 share
share
 share
share
 share
share
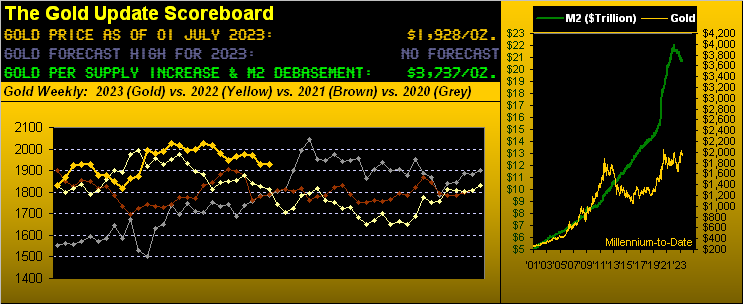
“Happy Mid-Year!” indeed with Gold up a gear — specifically +5.3% year-to-date — in having settled out this past week yesterday (Friday) at 1928.
That stated, you regular readers well know we purposefully this year did not (as we’ve otherwise done in years past) forecast a high Gold price for 2023. Rather, our only assumption continues to be that Gold shall record an All-Time High before this year is out, which it nearly did back on 04 May at 2085, falling just shy of the still existing record high of 2089 established on 07 August 2020. (For those of you scoring at home, the U.S. Money Supply by “M2” back then was $18.2T versus today’s $20.8T, i.e. ’tis now +14% higher, even as Gold by the same stint is -8% lower).
Still, to predict how high beyond the 2089 landmark Gold shall rise this year, we’ve opted to leave that to the FEF (“Fibonacci Extension Fanatics”). Oh to be sure per the above opening Scoreboard, we clearly value Gold today at 3737. And whilst Gold historically reaches up and through prior high value levels (our adjusted highest value level being 4031 as of 14 April 2022, from whence the Federal Reverse has been shrinking the Money Supply), we generally don’t expect such magnitude of leap to occur within a single year. For if it so did, we fear there’d be some seriously scary stuff afoot, (which already of course there is across the monetary/financial/geopolitical/leadership spectrum).
But: barring the NVDA (+189% ytd, p/e 218x) / AMD (+76% ytd, p/e 467x) / CRM (+59% ytd, p/e 553x) / AMZN (+55% ytd, p/e 311x) / et alia herd suddenly shifting into Gold, 3737 is otherwise out of reach by year-end. Indeed, Gold’s “expect yearly trading range” for 2023 is 346 points, such range here thus far at mid-year is 274 points. Solely within that vacuum, assuming the year’s 1811 low is in place, the record high in waiting is 2157. On verra, but hardly is that remotely near the 3737 value level. (Again, unless the NVDA/AMD/CRM/AMZN herd become boffed if not offed, by which time they may not have any dough left for a Gold trough).
Regardless, the stock market as measured by the S&P 500 remains up in goo-goo land, its “live” price/earnings ratio settling the week at 55.9x. Thus inverted, the “implied” yield is 1.789% which is quite near the actual yield of 1.537%, with everything to lose. Comparably, U.S. Secretary of the Treasury Janet Yellen’s riskless three-month Treasury Bill annually yields 5.153%.
“But Gold has no yield, mmb…”
Gold needs no yield, Squire. Present price (1928) to value (3737) is +94%: ’tis 18x sweller than that from Old Yeller. (…tick tick tick goes the clock clock clock…)
Now it being month-end, indeed both quarter and half-year end as well, ’tis time to bring the whole BEGOS Bunch into focus beginning with their year-to-date standings featuring Gold up a gear so far this year and still tucked in second place, sandwiched between the S&P 500 and Swiss Franc in rounding out the present podium:

Of precious metals’ note therein, whilst Gold is +5.3% ytd, poor ol’ Sister Silver is in near mirror opposition -5.9%. Which stands to reason for today’s Gold/Silver ratio being at 84.7x versus having closed out 2022 at 75.7x. The millennium-to-date mean? 67.6x, reversion to which puts Silver (today 22.76) +20% higher (at 28.52). The last date upon which the ratio matched its mean? 18 May 2021 (at 66.3x). Thus for you WestPalmBeachers down there, what does it all mean? “Get Silver!”
Moreover for the leveraged-minded of you out there, one might consider Pan Amercian Silver (PAAS). From 2001-to-date, its average price relative to Silver is 123%: today ’tis merely 64%. So if Silver itself is 20% low relative to Gold, and PAAS is but half its typical price level relative to Silver, run those numbers on your HP-12c. Rather riveting stuff, what? Either way, from one year ago-to-date, here are the percentage price tracks of Gold along with key of its equities’ brethren. And save for Newmont (NEM), PAAS nearly is last:
As for the whole gang, from top to bottom we’ve got Gold itself and the VanEck Vectors Gold Miners exchange-traded fund (GDX) both +6%, Agnico Eagle Mines (AEM) +5%, Franco-Nevada (FNV) +4%, the Global X Silver Miners exchange-traded fund (SIL) -3%, PAAS -29% and NEM -31%. Golden gifts, one and all!
Specific to Gold, whilst as cited +5.3% year-to-date, ’tis -7.6% high-to-date. Nonetheless we were (albeit perhaps premature) encouraged to see Gold’s lows this past week. For the current “front month” August contract, Gold reached as low as 1901 whilst “spot” tapped 1893. To wit, that which we herein penned on 27 May: “…our lean is that …1893 … is the extent of adversity on this down run…” or even that from just a week ago “…(still with 10 points of price premium) we’d see 1903, or by spot, 1893…” Bingo.
‘Course, that doesn’t preclude Gold further slipping, as we turn to its weekly bars from one year ago-to-date. Therein we see a sixth red dot of parabolic Short trend along with the green lines defining the oft-cited structural support running from 1975 to 1811, the mid-point being that 1893. So far, so good as it precisely has held. But ’tis cash management risky to misapprehend trend:
Speaking of misapprehending, how’s that Economic Barometer workin’ out these days? Talk about trendless across a year’s spectrum! Moreover, what’s up (literally) with the +0.7% revision to Q1 Gross Domestic Product from +1.3% to 2.0%? ‘Tis the second largest revision to “Final” quarterly GDP this century! And yet per the below Econ Baro: that broad purple line essentially defines the Q1 reporting period; looks fairly “unch” to us. (One wonders what they’re “taking in” over there at the Bureau of Economic Statistics):
Meanwhile, FedChair Powell inferred (depending on one’s source) this past week that at least (maybe) two more FedFunds rate hikes are in the cards for this year, and further that inflation may take years to tame. “Ain’t that a shame…” –[Fats Domino, ’55]. And the Fed-favoured inflation gauge of Core Personal Consumption Expenditures for May says ’tis so: it came it at +0.3%, which annualized is +3.6% — the 12-month summation now +4.3% — still more than twice the Fed’s target of +2.0%. As to the “elasticity” effect of FedHikes on the inflation rate, we’ll leave such to you brighter bulbs out there. But clearly there’s more pain to gain.
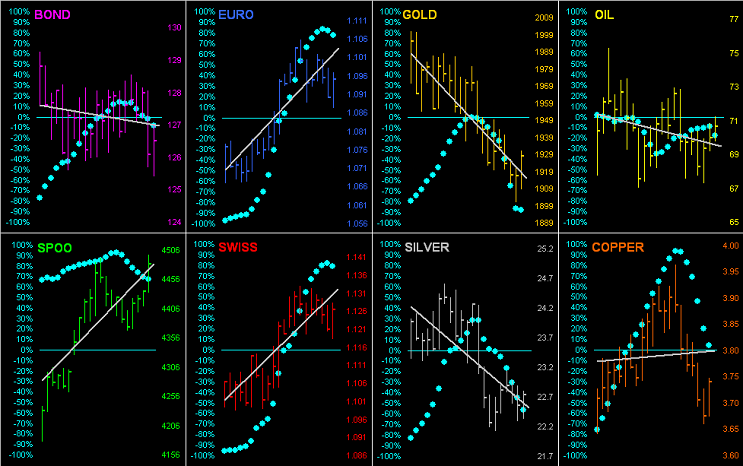
As to BEGOS Markets’ pain, let’s next go ’round the horn for all eight components across the past 21 trading days (one month) by their daily bars and baby blue dots of trend consistency. And as you can see, four of the grey trendlines are rising and four are falling; but in all eight cases, the “Baby Blues” are now in decline, certainly so those for Copper for which at the start of last week we so tweeted (@deMeadvillePro) in anticipating lower price levels. All of this of course is a harbinger of higher interest rates and thus the Dollar leading The Ugly Dog Contest:
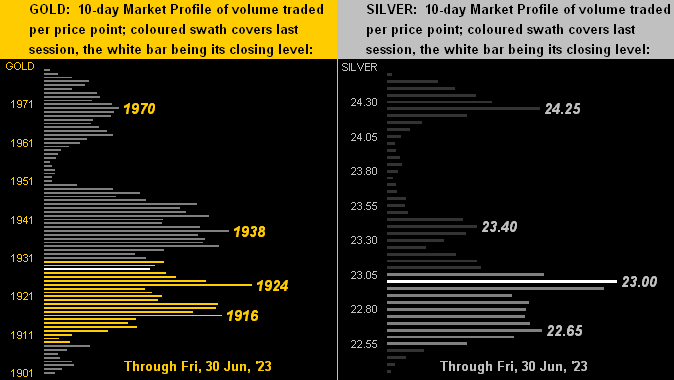
On to the precious metals’ 10-day Market Profiles, they appear a bit firmer than in recent weeks. Below for Gold on the left we see a good amount of trading support built in from the labeled 1938 to 1916 zone, whilst similarly so for Silver on the right from the 23.00 level to 22.65:
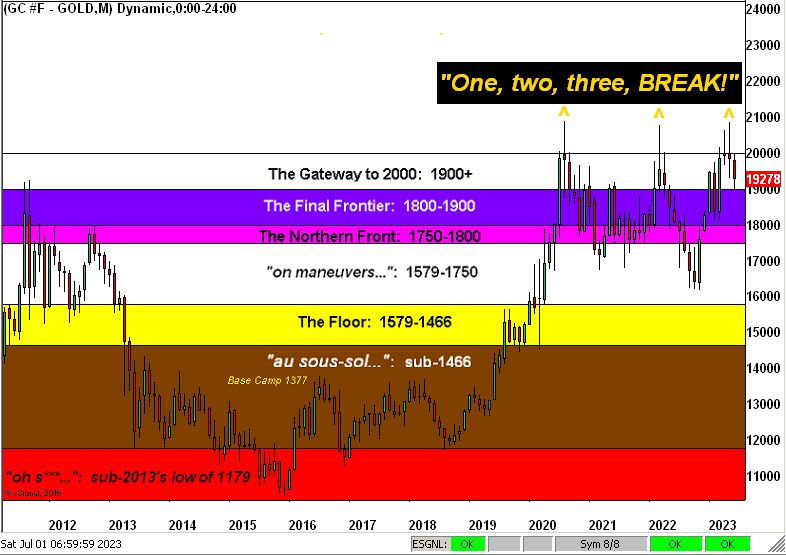
Again it being month-end, we present the Gold Structure by price’s monthly bars across the last dozen years, their labeled strata therein along with our ever-subtle reminder that “triple-tops are meant to be broken”:
To close, the more this stuff comes up, the more bemused we find ourselves. This time’ round over at an event hosted by the ever-regal Brookings Institution spoke one Graham Steele (Assistant Secretary of the Treasury for Financial Institutions), who stated “…Work on climate-related financial risk and the insurance sector is a top priority for the Biden-Harris Administration, the Treasury Department, and FIO…” (Indeed throughout the Secretary’s address the word “climate” was mentioned 38 times, thus the thrust of it all).
But the phrase “climate-related financial risk” really hit home with us with respect to the extreme undervaluation of Gold versus the extreme overvaluation of the S&P 500. This was discussed earlier today with a distinguished friend and colleague, who likened it to Publius Ovidius Naso’s character Icarus (8 A.D.) being the S&P as his bees-waxed featherings melted away upon approaching the sun, i.e. Gold:
So don’t find yourself head-over-heels when suddenly the S&P is “limit down”; rather, get some Gold!
Cheers!
…m…
www.TheGoldUpdate.com
www.deMeadville.com
and now on Twitter: @deMeadvillePro
********
share
share
share
share
share

Mark Mead Baillie has had an extensive business career beginning in banking and financial services for two years with Banque Nationale de Paris to corporate research for three years at Barclays Bank and then for six years as an analyst and corporate lender with Société Générale.
For the last 22 years he has expanded his financial expertise by creating his own financial services company, de Meadville International, which comprehensively follows his BEGOS complex of markets (Bond/Euro/Gold/Oil/S&P) and the trading of the futures therein. He is recognized within the financial community of demonstrating creative technical skills that surpass industry standards toward making highly informed market assessments and his work is featured in Merrill Lynch Wealth Management client presentations. He has adapted such skills into becoming the popular author each week of the prolific “The Gold Update” and is known in the financial website community as “mmb” and “deMeadville”.
Mr. Baillie holds a BS in Business from the University of Southern California and an MBA in Finance from Golden Gate University.


