A Hint Of Gold Price Backwardation


Last month, we noted that there could be a trend change in progress. Not only are the prices of the metals rising (which is just a mirror-image of the dollar falling, from 27.6 milligrams of gold just before Christmas to currently under 26mg). But the scarcity of gold as we measure it, using the spread between the price of gold in the spot and futures markets, has been rising.
What could cause this? One thing is for sure. It is not about the quantity of dollars. This theory is as popular as ever, despite the absolute lack of a rising gold price from September 2011-2016. The quantity of dollars has risen steadily since then.
We write much about the frequent cases when traders place big bets on something which is wrong. But the fact of their big bets drives up the price. Suppose speculators were betting on a big increase in the quantity of dollars under Trump. Then we would see a rising price alright, but we would see a rising basis—our measure of abundance of gold to the market. This cannot explain the current market either.
So what can? Recall Keith Weiner’s gold backwardation thesis. In times of stress or crisis, it is always the bid, and never the offer, which is withdrawn. Suppose the US Geological Survey were to make a dire announcement—THEY ARE NOT SAYING THIS, SO DO NOT MISCONSTRUE!! Suppose they said that there will be an earthquake in LA, an 11 on the Richter Scale. Nothing taller than a dollhouse will be left standing.
There would be no lack of offers to sell real estate. Some would hold out hope of getting “their price”. Others would generously offer to discount it 10% or 25% from the previous level.
However, what would be conspicuously absent would be a bid. Most likely from Santiago Chile to Vancouver, British Columbia and as far east as the Mississippi River. At least until the quake hit and the danger was passed.
It is gold that will withdraw its bid on the dollar. The bid sputtered 8 years ago, and intermittently since then. Then it has mostly been steady in the past few years. And now there is a hint of it, in the February gold contract. It’s just what we call temporary backwardation—a short term blip confined to the near contract that is heading into expiry.
However, we think it is notable. It means someone or many someones are switching their preference to gold, in spite of the higher yields available in the market now. Or maybe because of it. This preference, unlike speculators buying futures with leverage, is not about betting on price. It is about safety. Gold, unlike a bond, does not default.
Is this the explanation, and the whole explanation? We don’t know. We can only report that there is a change in behavior in the market. Whereas previously—this was the pattern for years—a rising price was accompanied by rising basis. And now we have rising price and the cobasis is rising instead. Rising scarcity rather than rising abundance.
To be sure, it is still a nascent trend. There is no guarantee that this won’t go poof like it has in the past. We will keep showing the data, and calling it like we see it.
Indeed, look for a new website soon. We plan to have more charts, many more, and updated daily. Including one data series that all the experts said could not be calculated.
Below, we will look at the supply and demand fundamentals for gold and silver. But first, the price action.
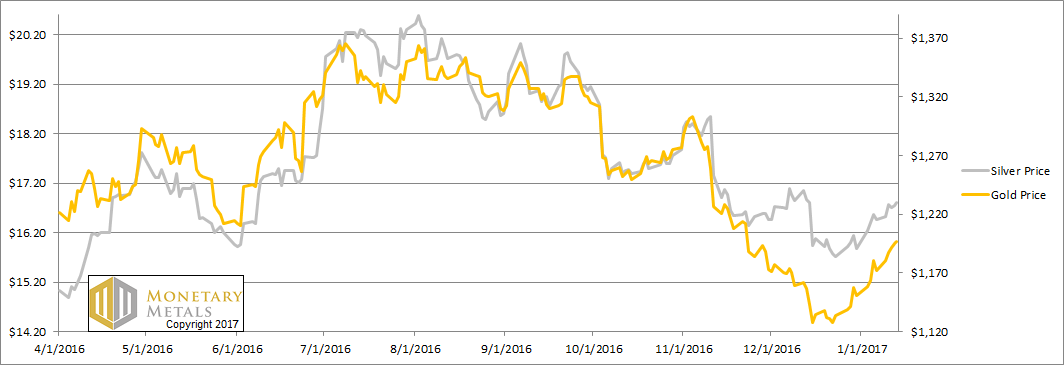
The Prices of Gold and Silver
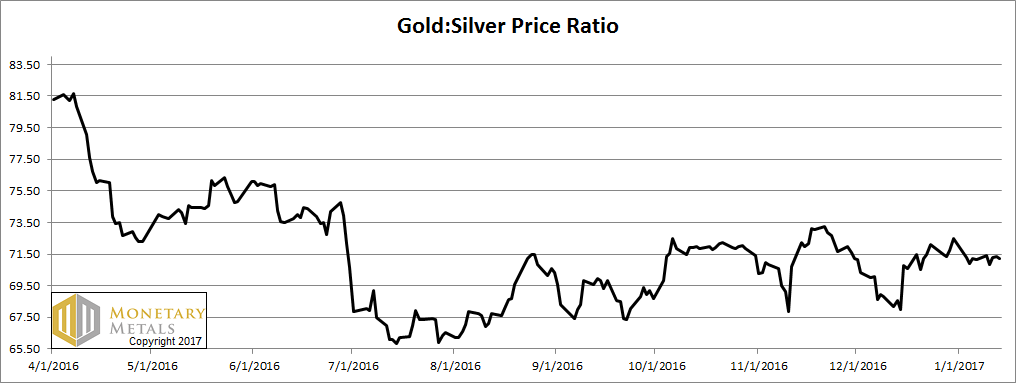
Next, this is a graph of the gold price measured in silver, otherwise known as the gold to silver ratio. It fell a bit this week.
The Ratio of the Gold Price to the Silver Price
For each metal, we will look at a graph of the basis and cobasis overlaid with the price of the dollar in terms of the respective metal. It will make it easier to provide brief commentary. The dollar will be represented in green, the basis in blue and cobasis in red.
Here is the gold graph.
The Gold Basis and Cobasis and the Dollar Price
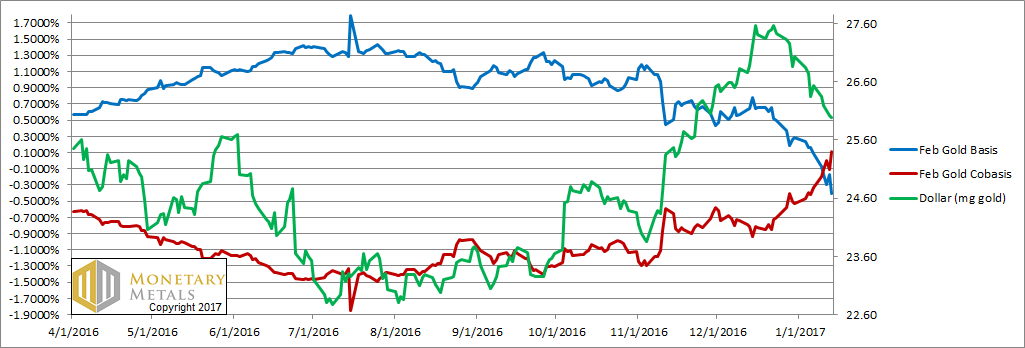
Look at that rising red line, the cobasis (our measure of scarcity). Since mid-December, it has moved opposite to the green line, which is the price of the dollar. Previously, they had moved together. That is, a rising dollar (i.e. falling price of gold, as measured in dollars) went with rising scarcity of gold, and a falling dollar had falling scarcity.
And now they are opposite. The more the price of gold is bid up (i.e. the more the dollar is sold), the scarcer gold becomes.
On Friday, our calculated fundamental price was just about $100 over the market price.
The February cobasis is +0.12%. That is, the Feb contract is backwardated.
Now let’s look at silver.
The Silver Basis and Cobasis and the Dollar Price
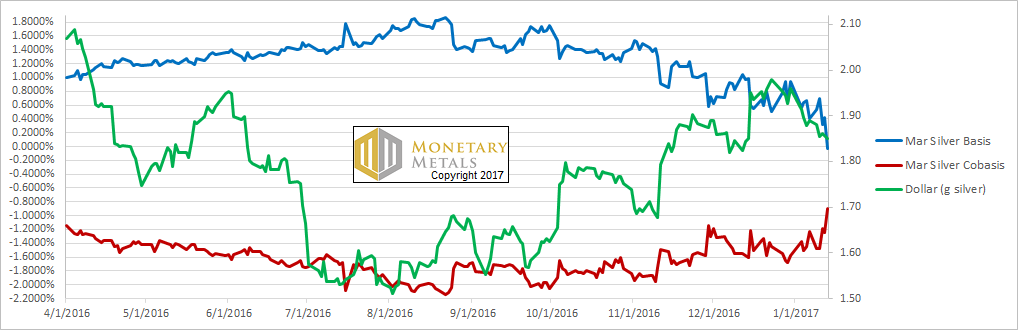
In silver the cobasis is rising a bit, though it is at a much lower level. Far from backwardation, it is -.90%.
Our calculated fundamental price moved up 3 cents from last week. It is no longer above the market price, as that moved up a lot more.
© 2016 Monetary Metals
 Dr. Keith Weiner is the CEO of Monetary Metals and the president of the Gold Standard Institute USA. Keith is a leading authority in the areas of gold, money, and credit and has made important contributions to the development of trading techniques founded upon the analysis of bid-ask spreads. Keith is a sought after speaker and regularly writes on economics. He is an Objectivist, and has his PhD from the New Austrian School of Economics. His website is www.monetary-metals.com.


