
How to Trade Using Market Sentiment & the Holiday Season
 share
share
 share
share
 share
share
 share
share
 share
share
The months of November and December are the second strongest back to back months for the financial markets. Many traders and investors use this time of the year to reap big gains as they close the year out. The fact that most traders and investors are sitting in cash and underweight stocks in their portfolio's leaves me to believe a Santa Clause rally is just around the corner. Reason being is everyone has cash on hand to buy stocks because they are selling their positions in this pullback we are in right now. I know traders well enough, they will buy back into the market trying to catch the holiday rally in the coming weeks.
Subscribers and myself have been short the SP500 for a couple weeks after watching the broad market become overbought and sentiment levels became overly bullish with greedy pigs thinking they could buy stocks after a massive month long rally that had not pullback. Once the selling started you would either get you head handed to you or you were going to make a killing buying leveraged inverse ETFs.
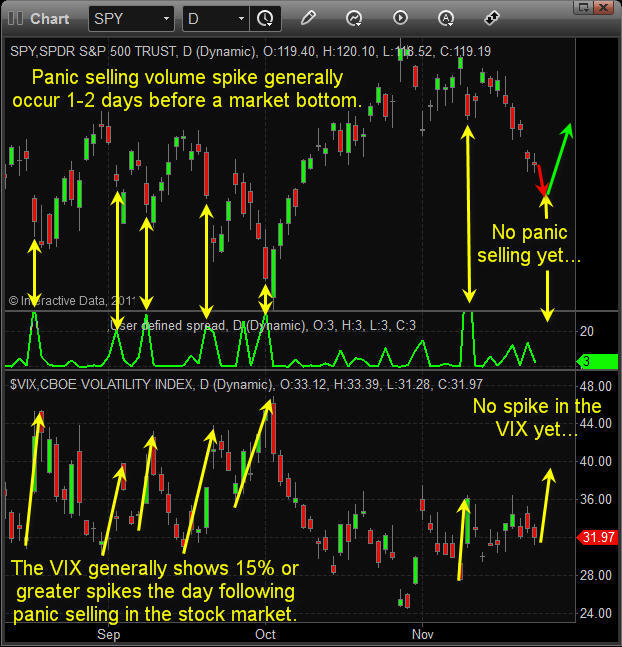
Those who arrived late to the rally are the ones selling out of their positions this week. The interesting thing about this week's market condition is that I have not seeing any real panic selling in stocks, and I'm not seeing the volatility index spike in value yet.
What does this mean? Well it means we could actually see another big dip in the market which should last 1-2 days and then we get a sharp reversal to the upside.
Take a look at the SP500 & Volatility index below
This chart allows us to get a feel for fear in the market. Me being a contrarian trader, I focus on market sentiment extremes. When the masses are losing money hand over fist I'm generally on the other side of that trade with open arms. Trading off fear is one of the easiest ways to trade the market. That is because fear is much more powerful than greed and it shows up better on the charts. Spotting panic selloff bottoms is something that can be traded successfully if you know what to look for and how to trade them.
On the chart you can see the pullbacks in the SP500 which triggered a panic selling spike in my green indicator. What I look for is a pullback in the SP500 and for my panic selling indicator to spike over 20. When that happens I start watching the volatility index for a spike also. The good news is that the volatility index typically rises the following day making my panic indicator more of a leading one...
I could write a 20 page report going into depth this with topic, but that's not the point of this report. Just realize that the stock market is likely going to put in a bottom very soon and likely end with a STRONG panic selling washout this week or next. If you want to learn more about how to trade market sentiment and panic selling you can read my strategy which was published in Futures Magazine: www.futuresmag.com/Issues/2011/January-2011/Pages/Market-internals-beat-the-herd.aspx?k=vermeulen
Prepare for a sharp drop in the market which should kick start a holiday rally in the next few trading sessions.
share
share
share
share
share

Chris Vermeulen has been involved in the markets since 1997 and is the founder of Technical Traders Ltd. He is an internationally recognized technical analyst, trader, and is the author of the book: 7 Steps to Win With Logic
Through years of research, trading and helping individual traders around the world. He learned that many traders have great trading ideas, but they lack one thing, they struggle to execute trades in a systematic way for consistent results. Chris helps educate traders with a three-hour video course that can change your trading results for the better.
His mission is to help his clients boost their trading performance while reducing market exposure and portfolio volatility.
He is a regular speaker on HoweStreet.com, and the FinancialSurvivorNetwork radio shows. Chris was also featured on the cover of AmalgaTrader Magazine, and contributes articles to several financial hubs like MoneyShow.com.


