The Investment Secret Of The 2000s…And It Has But Started


There is only one asset class on the horizon for most investors. Whether it is the professional or private investor, when they consider investing, stocks will always be first on their list. And if we exclude all debt instruments, the stock market is by far the biggest market in the world. Global stock markets are capitalised at around $80 trillion currently.
Stocks – A Stairway To Heaven?
Since the creation of the Fed in 1913, investing has been “a stairway to heaven” (Led Zeppelin). But there have been quite a few stumbling blocks on the way. In 1929 the Dow peaked at almost 400 before the crash. The low of the Dow was in July 1932 at 40 – a 90% fall. It then took 25 years until 1954 for the Dow to get back to 400. This gives an average return of 5% over a 103-year period excluding dividends. This is an excellent return and including dividends the total return approaches 10% annually.
As I have shown in previous articles, the rise of the stock market is very much linked to the increase in debt. Since Reagan came to power in 1981 for example, US debt is up 22X and the Dow up 20X.
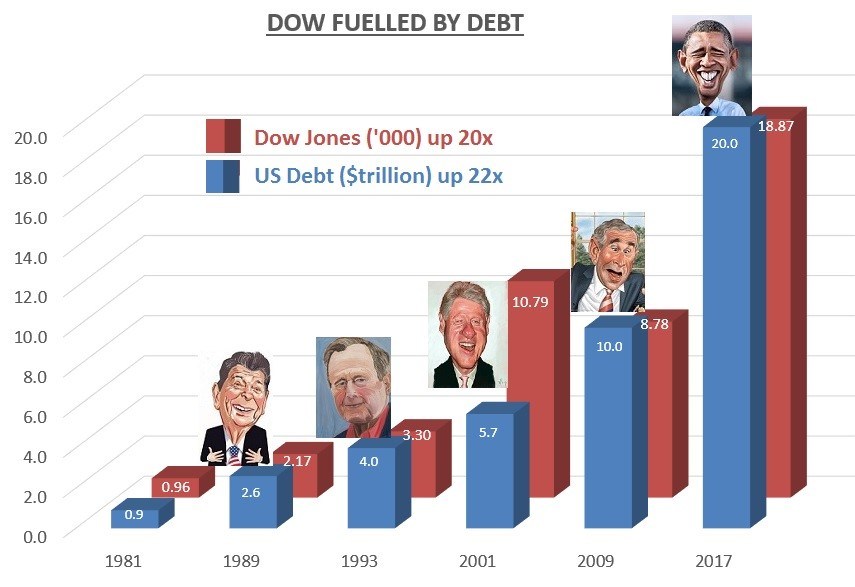
We are now getting to the point when increasing amounts of debt and money printing is required to fuel the stock market. With the Shiller P/E currently at 28.5, the stock market is in bubble territory and approaching the 1929 overvaluation level. But we are not yet in the super-bubble area of 2000. So in theory there is room for this bubble to grow yet bigger.
Caveat Emptor
But even if stock markets can become even more overvalued than currently, they are now at levels which represent unacceptable risk especially when we look at a mean of 16.7of the Schiller inde. This makes the overvaluation 70%. This necessitates a very stern “Caveat Emptor” (buyer beware) to any stock market investor.

The Investment Secret Of The Century
Although stocks, bonds and property all represent very high risk, few investors look for opportunities outside these markets. And it is for this reason that most investors have totally missed the best performing asset class in this century which is of course precious metals. Most investors don’t look at gold as an investment. Gold is regarded as a volatile commodity and does not appear in the average investment portfolio. Less than 0.5% of world financial assets are invested in gold today. This extremely low level of gold investment shows that very few people understand gold and even fewer look at the performance of gold. Most investors don’t have a clue how gold has performed in the 2000s. If they did know, they would realise that they have missed the best investment in the last 16 years by a very big margin.
The table below shows how gold has done in dollars and pounds compared to the S&P and the FTSE-100.
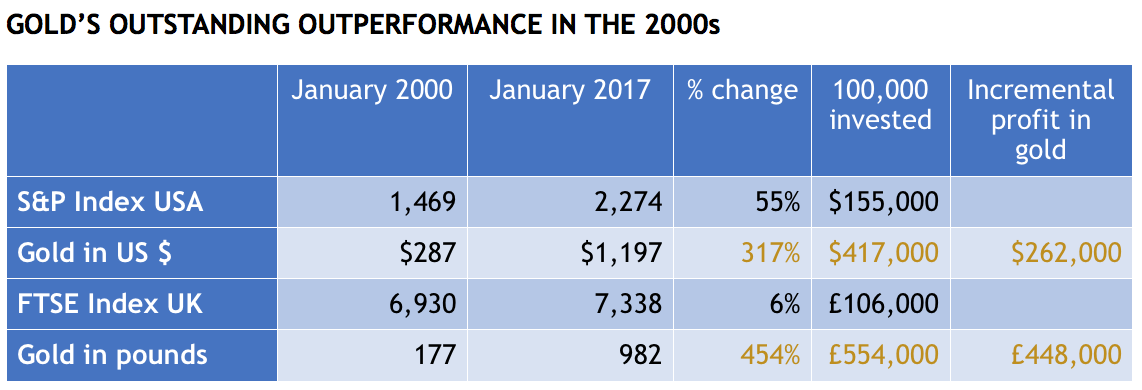
This little blue and white table above is the secret of this century. Investors in the US would have made $262,000 more by investing in gold than in the S&P. In the UK, an investor would have made £448,000 more by investing in gold instead of the stock market. Very few Brits realise that by buying gold in 2,000 and never trading it they would have made 5.5X their money. The sad thing is that neither the Brits nor the Americans realise that they would make even more money in the next five years by holding gold and silver.
But the average person sadly never buys an unloved and undervalued investment. He waits until the price has gone up substantially and it becomes headline news.
I have shown above what has happened to two major stock markets in relation to gold in this century. But that is just an example. The pattern and gold’s outperformance is consistent in virtually all stock markets in the world.
Stocks To Lose 95% Against Gold
These incremental returns by investing in gold are the secrets of this century. Only a very infinitesimal percentage of investors are aware of this. But even fewer investors are aware of what will happen in the next few years. Gold will continue to outperform stock markets worldwide by an even bigger percentage. As the chart below shows, the Dow has lost hugely against gold in this century. But that is just the beginning. The current correction up of the Gold/Dow Jones ratio has probably finished. This correction is very similar to the one in the mid-1970s. Next target should be sub 1 where it was in 1980. A 1 for 1 Dow Index vs Gold could be at 10,000 Dow and $10,000 gold or with hyperinflation they could both be at 100,000. At whatever level they meet, it means that the Dow will have fallen by at least 95% against gold. Very few people can envisage such a fall today but it would not be the first time in history.

Insatiable Silk Road Demand For Gold
As stock markets fall and gold rises, the increased demand for physical gold cannot be satisfied at current prices. Currently the silk-road countries of China, India, Russia and Turkey absorb virtually all annual gold mine production. The chart below shows the insatiable demand for gold in these countries. Since 1995 they have bought a total of 31,000 tons.
Gold Demand In China, Russia, Turkey And India
The acceleration in the Silk Road gold demand started in 2008 during the Great Financial Crisis. Since that time, these four countries have bought a total of 21,000 tons. That equals an average of 2,600 tons annually which is slightly less than annual global mine production. Some estimates consider the Chinese demand to be grossly understated in these figures. The demand from the Silk Road countries is likely to continue to be very strong in spite of current political problems in India.
As the gold price starts to rise, demand in the West will increase substantially. The dilemma is that this increased demand will take place during a period of falling goldmine production. Currently 3,000 tons are produced annually but this is expected to fall to 2,000 tons by 2025.
Institutional Demand For Gold To Treble
Official inflation figures have for an extended period been between 0% and 2% in most countries. Real inflation is of course considerably higher and even more so if asset inflation is included. But in spite of major increases in credit and money printing, inflation has been low due to low velocity of money. In 2017, we are likely to see an increase in the velocity of money leading to higher inflation and eventually hyperinflation in many countries. As inflation rises, institutional demand for gold will increase for inflation hedging purposes. Currently gold available for investment is around 0.4% of world financial assets. An increase to say 1.4% of global financial assets would involve gold purchases of $5 trillion. With annual gold production including scrap averaging around 3,500 tons in the next 8 years, the total gold production during this 8 year period would be $1 trillion at current prices. Thus there would be a total deficit of $4 trillion (at current prices) between demand and supply.
The only way that the increased investment demand can be satisfied is with higher prices since production cannot be increased. An institution who wants so spend $1 billion on gold would get 25 tons at current prices. But since there will not be enough gold available at the current price of $1,200, prices will need to increase at least fivefold to $6,000 within the next 8 years in order to satisfy the increase in demand. So for the $ 1 billion investment, the institution would get 5 tons of gold rather than 25 tons.
In addition to increased investment demand, there will be an even greater demand from the holders of paper gold. As the gold price rises, there will be a panic in the paper gold market as the paper holders of gold demand delivery. This is likely to push the gold price well above $10,000 in today’s money.
Fundamental And Technical Factors Point To Higher Gold In 2017
There are many fundamental and technical factors that point to an increase in the gold price in 2017. One of these is my good friend Ray Merriman, the foremost financial forecaster using cycles and astrology, who sees the gold price rising strongly staring in 2017 and continuing to at least 2020.
So for investors who hold physical gold and silver, 2017 should be a very interesting year. And for the ones who don’t $1,200 gold and $17 is an absolute bargain compared to what we will see in the next few years. But the most important reason for holding physical gold and silver is not the potential capital appreciation but as a hedge against a bankrupt financial system. Gold and silver is the best insurance anyone can buy as long as it is held outside the banking system.
Egon von Greyerz
Founder and Managing Partner
Matterhorn Asset Management AG
matterhorn.gold
goldswitzerland.com
 Egon von Greyerz – Founder and Managing Partner of Matterhorn Asset Management (MAM) and GoldSwitzerland based in Zurich. Egon forecasted the present problems in the world economy already in 2002 when he recommended to investors to allocate 50% of assets into physical gold (at $300) stored outside the banking system. Egon began as a banker in Geneva and was thereafter Finance Director and Vice-Chairman of a FTSE 100 company in the UK. He makes regular media appearances on CNBC, BBC and King World News and speaks at investment conferences around the world. MAM (founded in 1999), specialises in wealth preservation. GoldSwitzerland buys, sells, transfers and stores physical precious metals for private investors and institutions outside the banking system. His website is www.goldswitzerland.com.


