Ira Epstein Gold Report


COMMENTARY: A number of factors have impacted gold in a positive way over the past 30-days.
- Egypt has entered a climatic period whereby the Egyptian Government has declared a month-long state of “emergency”
- The Egyptian Army today was given authorization today to use deadly force to deal with protestors
- In the week ending 6 August, which was just a week ago, open interest fell massively, by 23.518 contracts according to the CFTC
- The CFTC reported last week that net non-commercial gold contracts also increased by the most since August 2012 before the QE3 announcement
- Chinese gold purchases were reported to have jumped 54 percent in the first half of the year
- The gold ETF “GDL” saw its first inflow in approximately 2-months as of August 9th
- Chinese July Industrial Production was reported to have climbed 9.7%, higher than expected
- The Eurozone was declared to have come out of its recession just yesterday with the first growth seen in a very long time, led by Germany and France
The negatives for gold remain lack of inflation, competing investments that pay dividends and/or interest.
In my last report I reported that a number of analysts were getting extremely bearish. I wrote in that report that “It’s hard to figure out where the decline ends, but $1200, $1100 and $1000 an ounce are numbers being thrown around by a number of market analysts.” As it turned out on June 28th December Gold Futures hit a low of $1182.6. Since then prices have rallied nearly $150 an ounce.
Weekly Chart
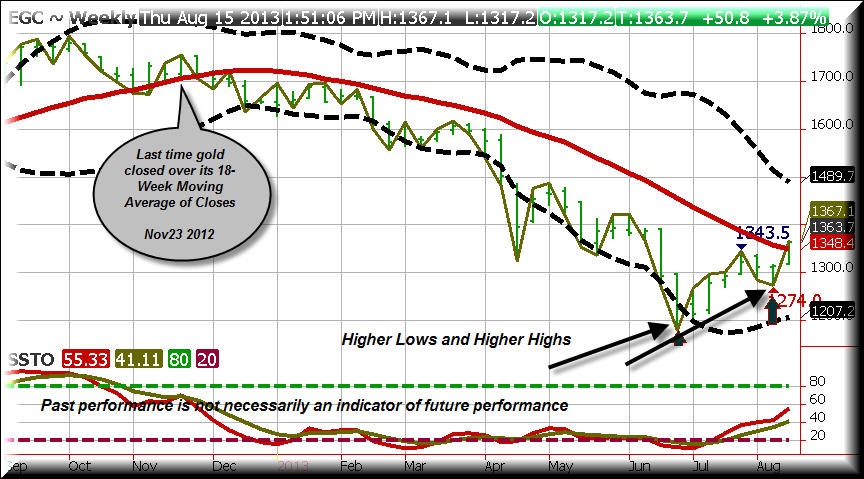
This could be the first week since November 2012 that gold closes over its 18-Week Moving Average of Closes. Don’t be surprised if gold uses that indicators price level, currently near 1350 level as a zone it trades against for a while. The important thing right now is that the weekly chart is no longer bearish with this week’s move up.
Even more interesting to me is that when gold lost its bearish SSTO (Slow Stochastic embedded reading) as shown on the lower graph, the overall objective was a move back to its 18-Week Moving Average of Closes. It’s taken about 6-weeks for this to occur, but the upside target was hit today.
I doubt that this move will carry up to the Bollinger Band Top of 1489.7 before consolidation take place.
Daily Chart with just Slow Stochastic Reading
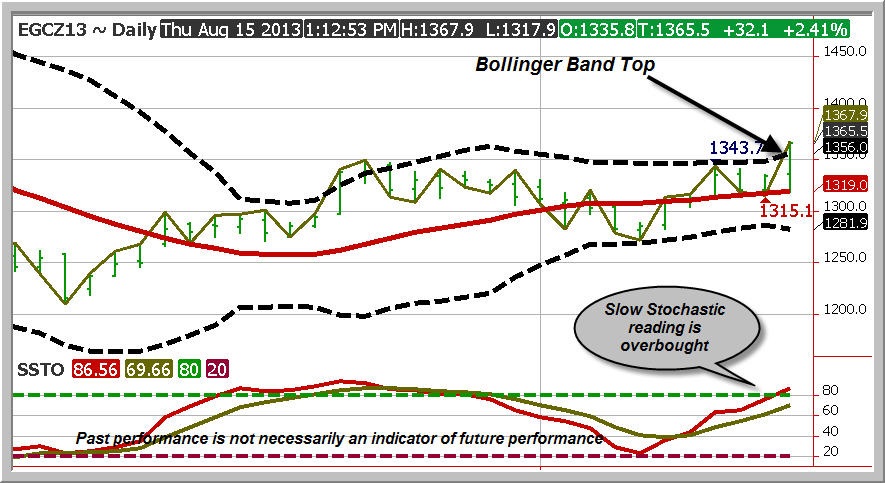
Gold is knocking on the door of the Bollinger Band Top. By the time you read this it would be of little surprise if prices aren’t over this number. Today’s rally was triggered when the Egyptian Army gave its soldiers orders to allow the use of deadly force after 7 soldiers were reportedly killed today at a roadblock. Add to this the hundreds of civilians killed yesterday, calls for more protest movements and you have reasons for gold’s advance today.
I’ve been telling my customers that the sideways tight banding of gold, as displayed by the dashed lines on the above char that makeup the Bollinger Band often are a signal that something big is brewing. Gold has gone sideways, in its Bollinger Band for a while now.
The only part of the bullish equation that doesn’t yet fit for a super bullish case is the overbought condition of the SSTO (Slow Stochastic) Indicator which is currently overbought and not even close to yet turning into a locked in uptrend, called embedded.
Seasonal Gold Chart
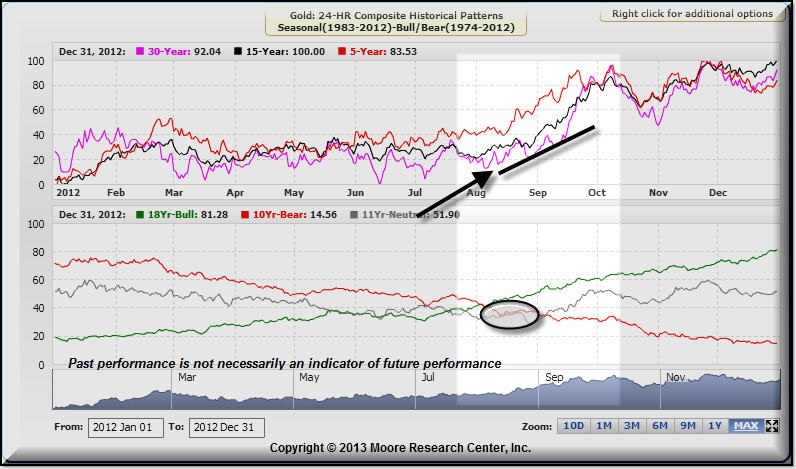
Gold is in a time frame where prices often rally. This is a yearly event and while todays’ rally was the “ringing of the bell” whereby the press finally took notice of what’s going on, this rally has been going on for a while.
Even the 10-Year Bear Trend Line, shown in red, assuming you’re viewing this in graph in color, shows that a bounce often occurs around mid-August. When you look at the top graph, you see that be it the 30-15 or 5 year pattern, rallies at this time of year into year-end often take place.
Summary
Obviously there are serious limitations in trying to use history to predict the future. However, historically speaking gold has shown a strong tendency to rally from mid-August into September.
I was hoping to have more time to recommend a gold straddle, as the sideways action in the Bollinger Bands was simply so compelling. As it turned out I’m a day late as the market seems to be resolving itself to the upside.
********
To receive my specific trade recommendations, you should consider becoming a subscriber to my Market Information. It’s inexpensive and includes a lot of market research.
To become as subscriber, simply click on the link below or type this link into your web browser:
http://www.iraepstein.com/client-non-client.html or Call 1-866-973-2077


