It Was A Week Of Mystery


There is a statement about equities that is often repeated: stock markets value the state of the economy from 6 to 18 months in advance. Over the past 5 weeks since 11 February the DJIA has rallied more than 12%, to close within 6% of the all-time high. At the regular FOMC meeting of January 26/27, the official outlook for the US economy was positive enough to anticipate three more rate increases in 2016 that would take the rate to 2%. Then at the recent meeting this past week, the situation had deteriorated so that further increases were delayed and the rate was expected to remain below 2% ‘for some time’. The mystery is what the DJIA knows about the economy that the FOMC with the full resources of the Federal Reserve to rely on, has missed?
The subject of the two opposing views is not some obscure corporation about which little is known, but the vast and yet minutely studied US economy, where very little of consequence happens that is not measured at least two ways and commented on by academics and private economists alike. The DJIA revival only could make sense if doomsayers about the future of the economy were all from the tinfoil hat brigade, but warnings of an imminent bear market on Wall Street have come from some of the major financial institutions in the US and elsewhere. Yet, despite these warning flags, including that from the FOMC, a flood of funds flowed into Wall Street for the past 5 weeks, sufficient to absorb all the selling by those who heeded the warnings and also to raise the DJIA by almost 12%.
This is very strange behaviour by whoever commands the large amount of funds to accomplish such a formidable revival. That these funds came from a many smaller individual investors can be ruled out as most unlikely; a change of heart among so many people would be noticed in the media and in the way trading happens. A lack of central coordination would have meant the rally moved in fits and starts, not the almost straight line ascendancy with very limited hesitation. This sudden and near unbroken rally is not unique; over the past 9 years it has happened twice before – both quite recently, in October 2014 and September 2015, in both cases after the DJIA had fallen steeply as if to begin a bear trend.
If that should be a common thread behind these remarkably sustained rallies, that they come to Wall Street’s rescue when the Bear seems ready to take over, then it is not too difficult to conclude that it cannot be many small investors en masse in pursuit of bargains that are responsible, but some entity with a vested interested in a bullish DJIA. Of course, the responsible party with access to enough funds is easy to identify; it can only be the Fed operating in disguise, concealing itself behind its primary dealers and perhaps other large institutions.
So it really is not much of a mystery after all. However, realising a lack of mystery in something that has happened three times since early 2014, leads to a conclusion that the US economy is really considered to be in such dire straits over at least the past 3 years that intervention is required to ensure the message from Wall Street is that the economy is robust and sound. This then also places the recent rate hike in a different perspective; it was not done in response to rising inflation or an economy in full bloom, but – as suspected by some – because the FOMC had to act to retain any creditability following their repeated on again, off again rate hike warnings.
The further conclusion has to be that the Bear is waiting in the wings and, despite a few prompts to take centre stage that so far have been mistimed, will take over the leading role in the not too distant future. No wonder more and more investors, from all parts of the world, are seeking the safe haven of the precious metals.
The mystery question also now becomes not why Wall Street is bucking considered opinion on the state of the economy, but why the main media persists on reporting nothing that can prick the optimistic bubble of an economy that is in good condition and growing steadily, if slowly. Are they really part of the conspiracy?
Silly question, of course, based on the available evidence! Not a mystery at all.
Euro-Dollar Chart
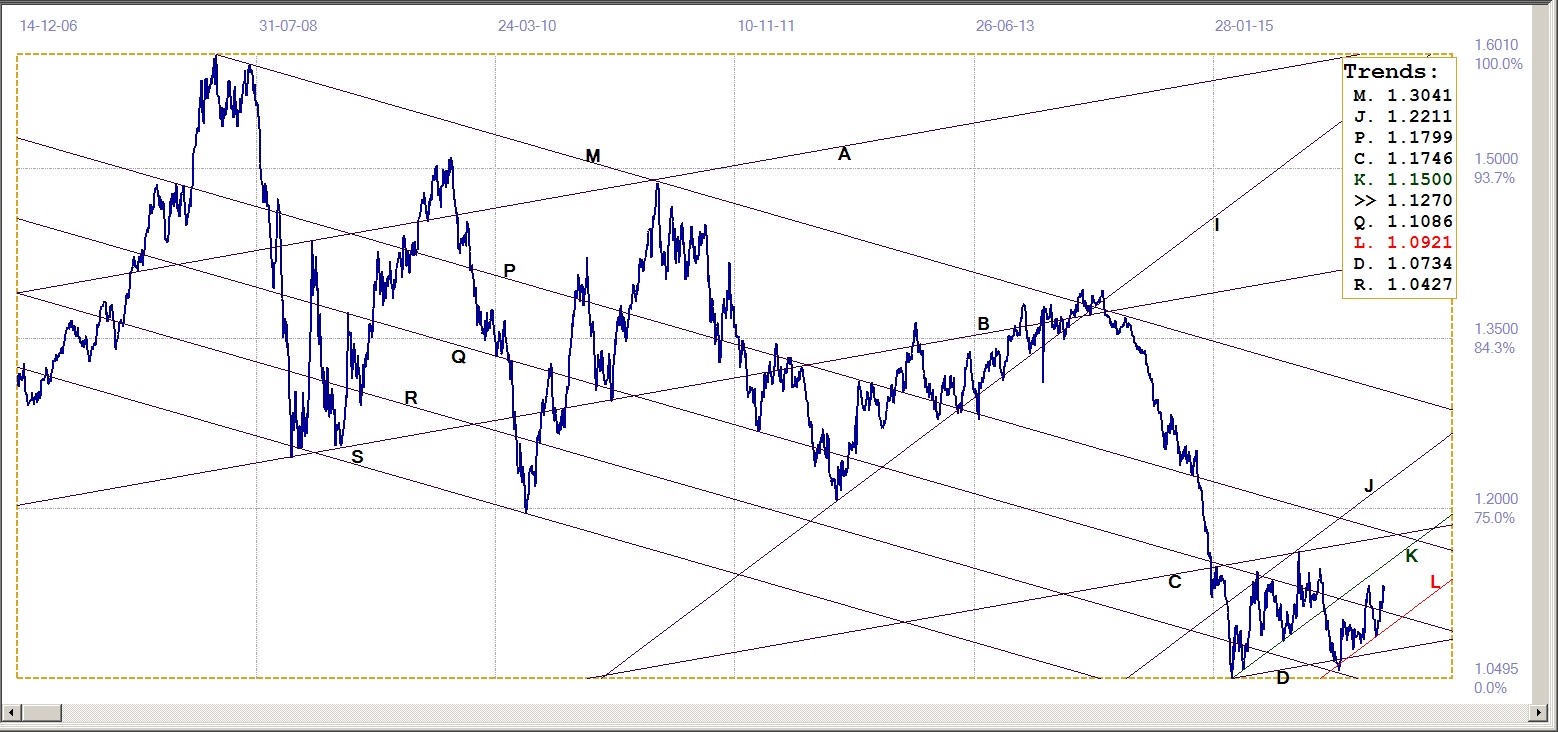
Euro-dollar, last = $1.1270 (www.investing.com)
The euro’s steep recovery off key support at the bottom of channel KL ($1.0921) is confirmation that the volatile and then failed bullish trend in channel JK ($1.1500) is being resumed in the parallel extension below the original channel. The break back above the resistance of line Q ($1.1086) confirms the momentum behind the move higher by the European currency. However, technical analysts would comment on a double top now in place and expect a new reversal lower. This week should reveal whether the resistance traditionally associated with a double top is to play a role, or whether the close last week was simply a convenient halt in the new bull trend.
Dow Jones Industrial Average (DJIA)
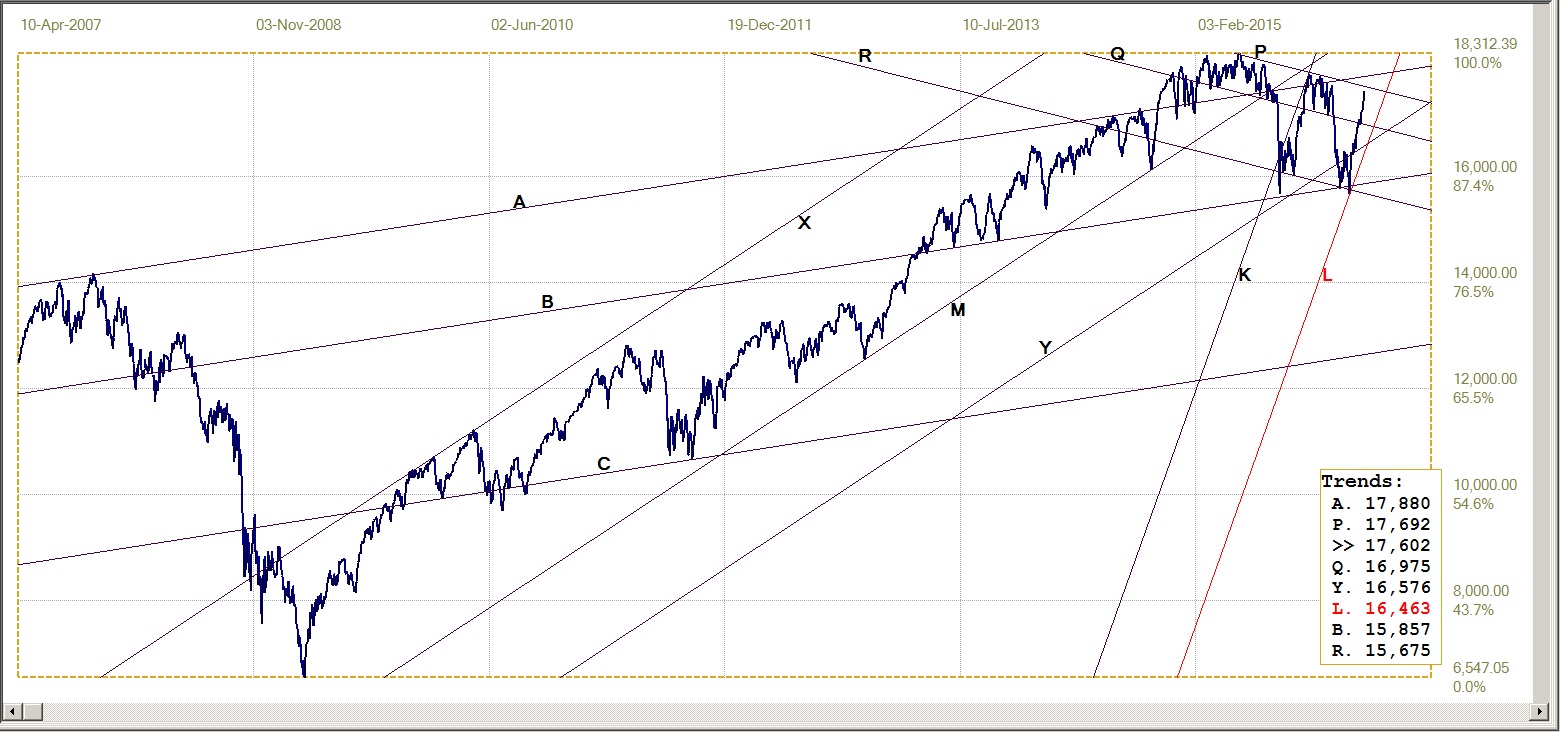
Dow Jones Industrial Index, last = 17602 (money.cnn.com)
A week ago the comment on the DJIA began with noting its remarkable levitation, which is discussed more fully this week. The index is approaching resistance at line P (17692). the top of its current bear channel. That leaves less than 100 points for a test of that resistance, and the way the DJIA is boosting its way higher that is not a real challenge.
Even the next resistance at line A (17880) is within reach of one day’s trading, with the DJIA easily overcoming weak starts to the trading day through sustained buying that does not tolerate any weakness for very long. It is an open question if or when reality will become compelling enough – despite optimistic interpretations of official statistics – to where the bears can take over on Wall Street and not be routed again after yet another spike low that reverses as steeply as the fall in value.
However, they recently have had more lasting success that during the rush to the top of the market that kept within channel XM despite many aborted sell-offs. The next one could just be the straw that crashes the Wall Street myth.
Gold PM fix - Dollars

Gold price – London PM fix, last = $1252.10 (www.kitco.com)
Gold has had a spectacular – for the metal, considering its recent history – rally off the support along line R ($1049) to become a little more hesitant is it approached a technical resistance level at line C ($1272). The brief and limited break two weeks ago to above that resistance was the top of the rally. Since then gold has reacted to that technical resistance as if it were a real barrier.
It had moved clear of the rising support at the bottom of channel KL ($1200) to create quite a nice buffer to enable a sideways trend, perhaps holding below line C, for quite some time before the support is to be challenged. There is no need for the sideways move on technical grounds, although a failed test of the support would be a positive sign that the bull trend is intact. A far better bullish signal, though, if gold soon breaks above the resistance along line C to resume the rising trend after two weeks of ‘resting’ in a sideways trend.
Gold PM fix - Euro
The euro was a beneficiary of the recent dollar weakness and rebounded of support, as discussed above. With gold being stuck below technical resistance, a strong euro exacted a toll on the euro price of gold to bring the new rally to an end. A reversal lower carried the price lower, but still well clear of the support of new bull channel KL (€1073). The top of the recent rally is nevertheless still short of the next levels of resistance at lines R and W, both currently at about €1182.
The euro is still vulnerable to actions by the migrants and Draghi, both of which can be responsible for sudden euro weakness. The effects of the often referred to ‘race to the bottom’ for the major currencies, in various commentaries, have been more noticeable in the euro than in the dollar, at least until a week or two ago, when it became a belated entry in that competition. It might catch up soon, though, as its coach, the US Fed, has been printing money as fast as its still could in an attempt to have the dollar fit and ready for the race!
Weakness in the dollar index shows the success of this preparation and if this trend were to continue, the euro price of gold could well be testing the support along line L quite soon, perhaps as early as this week. If so, for the support to hold would call for the price of gold to break above its current resistance to resume and extend the new bull market.

Euro gold price – PM fix in Euro, last = €1108.6 (www.kitco.com)
Silver Daily Fix Chart
Silver has a good week with an increase that briefly broke above the $16.00 level to set a new intermediate high since the recovery off support at line S ($1362). The improvement last week was sufficient to keep the price of silver above the steeply rising support of channel KL ($15.81). However, the $16.0 barrier must be broken soon if silver is to hold within that steep bull channel.
On the charts, the gold rally looks much more impressive than the performance by silver. Yet the 17.4% gain by silver since the end of January – while not matching the 19.3% of gold over the same time frame – does not lag gold by much. If silver can continue this week as it had performed last week, the difference in performance could easily be wiped out. The vehemence with which the silver price is suppressed, if indicative of its greater danger for the Big Banks, also means the silver price would outperform that of gold once the pressure is relieved.
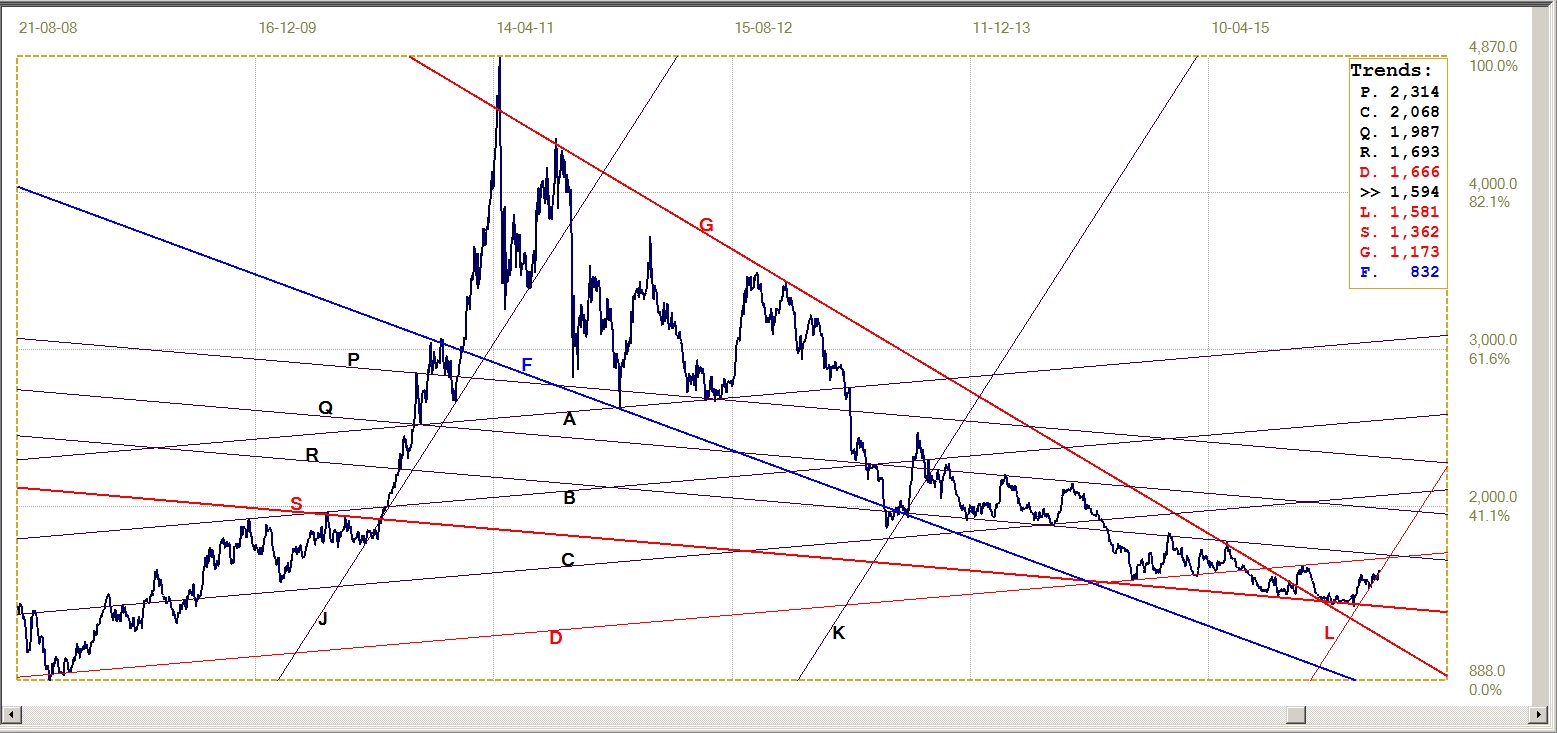
Silver daily fix, last = $15.94 (www.kitco.com)
U.S. 10-year Treasury Note
The recent weakness in the bond market ended when the yield of the 10-year US Treasury note reached technical market support at line K (1.951%). The support held and the market turned bullish again, carrying the yield down to Friday’s close at 1.877%.
This move is more aligned with the observation that the dollar and the bond market tended to hold opposite trends – when one was weaker, the other firmed. This gave rise to a suspicion it was to some degree engineered to ensure that foreigners who owned Treasuries would not turn sellers because their value fell in local currencies.
While the euro appears bullish, if it does manage to break above its double top, the 10-year Treasury note is close to its rising resistance at the bottom of bear channel VW (1.864%) and can not continue lower without a new bullish signal – which does comply with the dovish views of the FOMC at its meeting this past week.

U.S. 10-year Treasury note, last = 1.877% (www.investing.com)
West Texas Intermediate crude. Daily close
The WTI price of crude has rallied to briefly break above $40 psychological resistance – but at the end failed to hold the break. The global situation with respect to crude oil is complex, with the role of the US having changed markedly over past years. It used to be the biggest importer of oil, but with growing production from the shale fields it has become a major player on the global supply side.
It is accepted that all is not transparent when it comes to oil. There is well founded reasons for OPEC countries to lie about there confirmed reserves and probably their production as well, in order to influence the assignment of quotas. Exports that are conducted ‘under the counter’ from Iran, in their attempt to escape the constraints of sanctions, perhaps in collusion with China and also others who desperately need cheap oil, while Turkey is smuggling ISIS oil into the market, means that statistics on supply and demand cannot be trusted.
Then it also means that reactions in the price on perceived volumes of supply and demand might not represent proper price discovery based on real fundamentals. It is a market just made for all kinds or rumours and speculation and thus for those in the know to profit from sneaking a false fact of two into a communication channel.
It is a well known fact that supply in the US was boosted by production from shale oil, enough to turn the US from importer to exporter. Demand, on the other hand, has been falling as the global economy tapers down in a debt-induced contraction. It is the over-supply that has resulted from these two trends that appear to be the main driver of the bear market in crude oil.
Now supply from shale oil should decrease in time, while the prices remains below their breakeven level, while other supply, from Iran, increases as they try to restart their economy – this while, according to the Baltic Dry Index for shipping costs and in terms of Chinese export data, the global economy is in a steep decline. Demand therefore has to be in decline as well.
How this will play out in the rest of 2016 is difficult to determine, but technically the minor break above resistance at line K ($38.69) has to hold and extend higher to challenge resistance at line S ($43.58) in order to sustain the new rising trend.
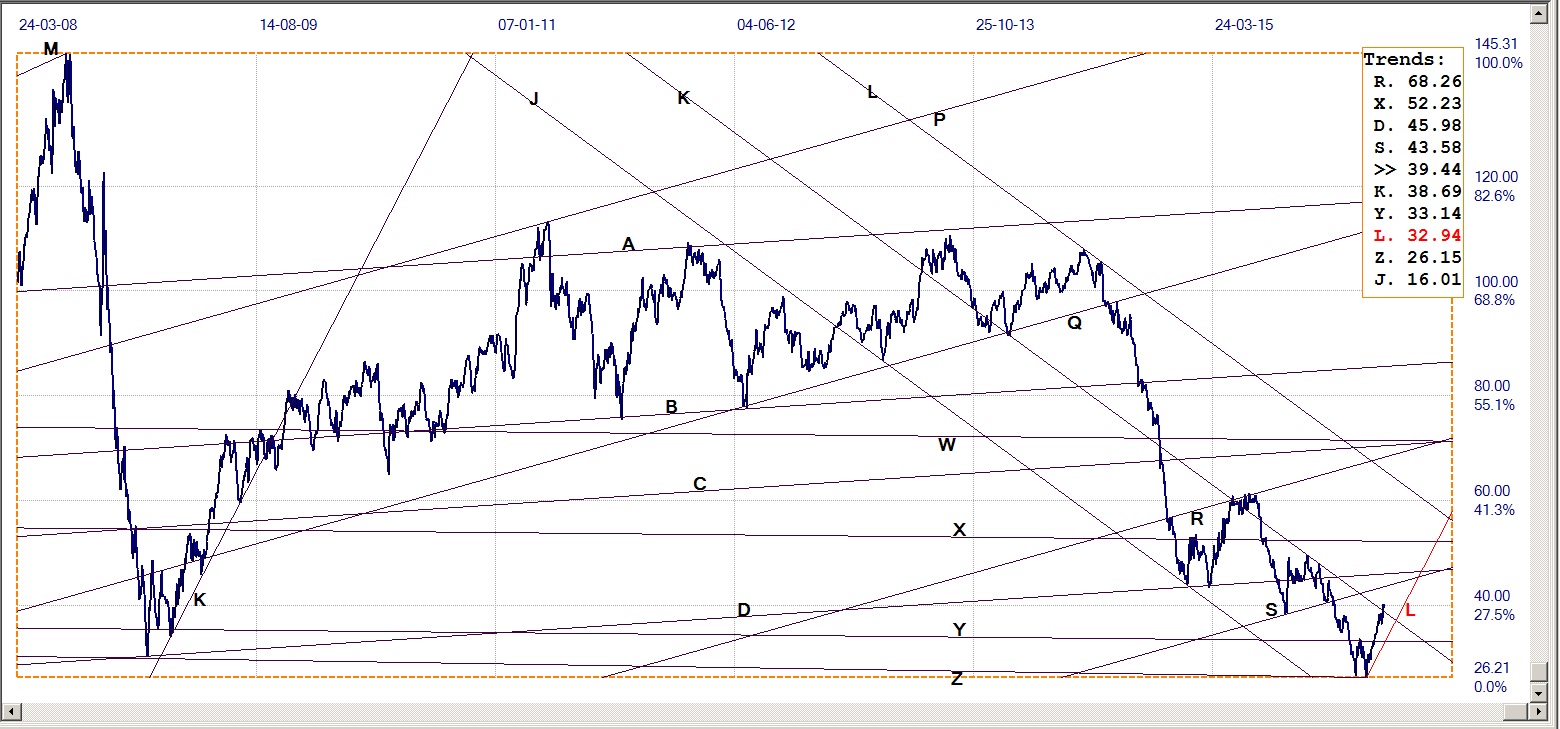
WTI crude – Daily close, last = $39.44 (Investing.com)
©2016 daan joubert, Rights Reserved
chartsym (at) gmail(dot)com


