Market Turning Points


Current position of the market
SPX: Long-term trend – In 1932 and 1974, the 40-yr cycle was responsible for protracted market weakness. The current phase is due this year but where is the weakness? Has man (Federal Reserve) finally achieved dominance over universal rhythms or has it simply delayed the inevitable?
Intermediate trend – The correction is over and what is most likely the final phase of the uptrend (before a more serious correction) is underway.
Analysis of the short-term trend is done on a daily basis with the help of hourly charts. It is an important adjunct to the analysis of daily and weekly charts which discusses the course of longer market trends.
APPROACHING AN IMPORTANT HIGH?
Market Overview
According to the Trader’s Almanac, September is the weakest month of the year. What better time for the stock market to have a long overdue correction of intermediate scope. I indicated under “Long-term trend” above, that the heretofore predictable 40-year cycle rhythm had sorely disappointed the bears, this time. Will the month of September do likewise? Perhaps not! There are some sound reasons why bearish expectations will be at least partially redeemed in the near future. Let’s examine some of them:
The weekly MACD approaches the beginning of the month in a state of double negative divergence. This reflects price deceleration on an intermediate scale. Of course, this is not a final verdict! The MACD is still in an uptrend and, if it continues to move up, could nullify the divergence. However, the daily MACD also exhibits negative divergence and, judging by its histogram which has started to decline over the past four days, it may also be losing its upside momentum.
Next, we should look at the all-important breadth indicators. As we will see a little later on, the McClellan Summation index has also developed some serious negative divergence. This indicator gives a good appraisal of the intermediate condition of market breadth. It is still positive and moving up and its RSI has not yet reached the overbought condition which normally defines a top, so we need to wait until next week to see where it stands. The McClellan Oscillator is still consolidating after its recent overbought condition but Friday’s market close has also earned it some negative divergence. My own daily A/D oscillator is in the exact same position. Nothing decisive there yet, but we can rate breadth as having a small negative bias at this time.
After evaluating price momentum and breadth, the third important ingredient to examine is structure.
Most serious and competent EW analysts believe that the market has entered the final stages of its uptrend from October 2011. In their views, the final fifth wave of that entire sequence started at the beginning of the month -- from 1905. What remains somewhat murky is whether we are currently in wave 4 of 3, or in wave 4 of 5. If the latter, then we are days away from completing the entire structure and starting the first serious correction since the one which ended in October 2011 -- which fostered a decline of nearly 300 points and took about 5 months to accomplish.
Next are cycles. Is the 40-year cycle going to complete its phase with only a whimper, or will it make up for lost time at the last minute? Or yet, will it make a late showing, delaying its final phase by a few months? That is for the future to tell us. It is not prone to inversions but, nevertheless, in the face of the potential substantial risk which lies directly ahead, it would be best to expect the worst and hope for the best.
The action of IWM is a serious concern. It has remained well below its previous double top (?) while SPX has made a new high. As a leading index, its lagging state should be taken seriously. Note also that the DJIA has only made a fractional new high, while the transports are also lagging, as is the NYA.
And finally, there is this from the SentimenTrader: “VIX option traders appear to be betting on a sharp rise in fear according to several measures”. In my assessment of the chart pattern (discussed a little later), I point out that it is currently exhibiting strong positive divergence to S&P. That is a negative for the market.
Chart Analysis
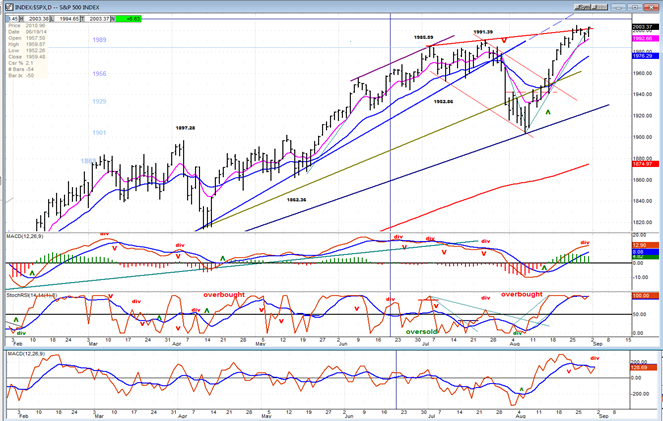
 The Daily SPX (chart courtesy of QCharts.com) has run into some resistance from the extension of the line drawn across the two previous tops. Until it breaks through, it will continue to consolidate below that line. Its inability to move higher could be a sign of weakness or that it needs more preparation after its strong advance. I suspect that it is the latter as the index may still be completing a small corrective wave. As long as it remains above 1994, it is in a consolidation stage. Dropping below would be a sign of weakness, and below 1991, most likely a confirmation that a decline has started.
There are several potential projection levels. The first one, 2005, has already been reached. 2014 and 2034 are also candidates. From there, a small pull-back took place followed by a return near the target level which could be a test of the high. If this results only in further consolidation, the index should break through and try for the next projection. Divergence has already developed in some of the oscillators and the SRSI is overbought. None of this is terminal yet, but if the oscillators turn down and the MACD manages to develop a bearish cross, things will start to look more serious for the bulls.
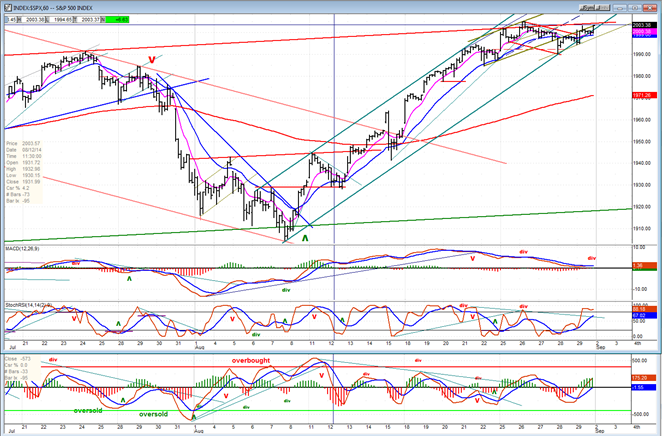
The hourly chart (also courtesy of QuoteCharts.com) is next.
From 1905, SPX moved directly to a new high, found some resistance at 2005 (which was a potential target), pulled back for a couple of days, found support on its rising channel line, and is now re-testing its high.
The index may be in the process of creating a wave 4 from its low before completing wave 5 and starting a larger correction. Potentially, it is now finishing the “b” wave of 4 before starting on “c”. If that’s the case, it would have to come out of its channel and conceivably create a larger one. The alternative is that wave 4 is already complete and wave 5 under way.
The oscillators are mixed with the MACD showing the most weakness, but perhaps in the process of turning up. Their current state could support an extension of the move before starting to correct.
Cycles
The 40-year cycle whose low is (was) ideally due around October should have made its presence felt long ago and has little time left to avoid being a total failure! But it would not be alone. A long string of correlated cycles were also due to bottom at this time. What happened? The most likely explanation is that the bottoming process may have been delayed (to 2016?) by the Fed intervention.
Breadth
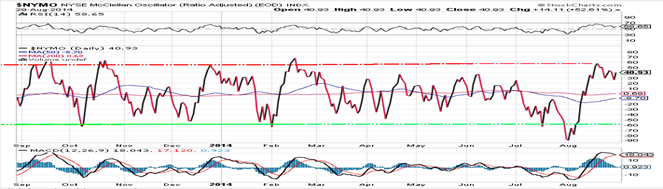
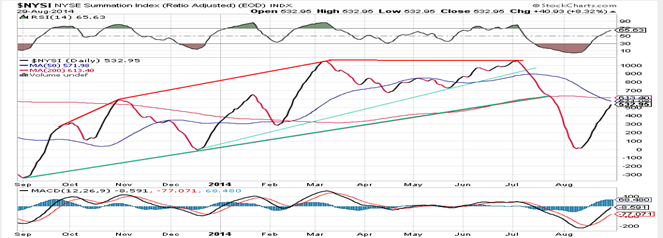
The McClellan Oscillator and the Summation Index appear below (courtesy of StockCharts.com).
The McClellan Oscillator has held up well after its rise to overbought status. This has helped the Summation Index to make a good recovery after dropping to the zero line. A downturn from this level would risk having the NYSI go negative after some strong divergence, but this would only happen if the NYMO turns negative again and remains in that position for a length of time.
Sentiment Indicators
The SentimenTrader (courtesy of same) long term indicator remains at 60. It may have to reach 70 once again before we get to the top of the move.
VIX (NYSE Volatility Index) - Leads and confirms market reversals.
VIX has refused to participate in the new high of the SPX by making a new low, thereby creating some positive divergence. In fact, it could even be said to be exhibiting double divergence. This is not supportive of a continued uptrend in the market, and concurs with the SentimenTrader observation (above).

IWM (iShares Russell 2000) - Historically a market leader.
It is evident that IWM has been losing upside momentum. This has created an increasing gap of relative weakness with the SPX which has continued to make new highs. Unless this index can find some renewed strength, the next time it turns down could correspond to the beginning of a serious decline in the overall market.

TLT (20+yr Treasury Bond Fund) – Normally runs contrary to the equities market.
If TLT is a contrary indicator, why has the market not started to go in the opposite direction? Or is it just a matter of time before it does? The index continues to move in an uptrend but is closing in on the top of its bullish channel. This should cause a pause in the advance.

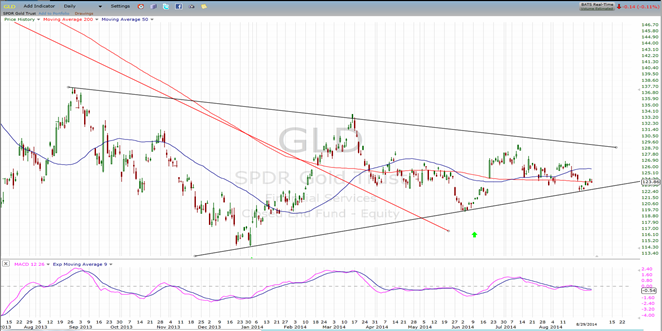
GLD (ETF for gold) – runs contrary to the dollar index
In spite of the continued strength in the dollar, GLD has managed to hold above its lower trend line. Any consolidation in the dollar should help it regain its short-term upside momentum, but the 25-wk cycle low is past its peak and will increasingly pressure gold prices. Any attempt at breaking out will have to come quickly to be successful. In truth, this is beginning to look more and more like a consolidation pattern in a downtrend which could see the index drop down to about 105 over the short-term trend.
UUP (dollar ETF)
UUP continues to act well, only making a minor consolidation in its uptrend. It may not find many sellers until it gets to about 22.50 which is not only the top of its basing channel, but also the near-term P&F projection for the first phase of its advance.

USO (US Oil Fund)
After its recent decline, USO is entitled to an oversold bounce. If it is duplicating the pattern which it made starting September 2013, it will keep going until it reaches its long-term trend line where it should find enough support for another rally attempt.

Summary
Evidence is mounting that SPX is coming to another inflection point. The warning signs are detailed in the Market Overview section (above). These, and the fact that September is notorious for being the weakest month of the year, combine to issue the reddest flag yet: that an important top may be approaching.
I should objectively point out that neither XBD nor XLF (also reputed market leaders) has any disagreement with SPX at this time.
********
FREE TRIAL SUBSCRIPTON
Market Turning Points is an uncommonly dependable, reasonably priced service providing intra-day market updates, a daily Market Summary, and detailed weekend reports. It is ideally suited to traders, but it can also be valuable to investors since highly accurate longer-term price projections are provided using Point & Figure analysis and Fibonacci projections. Best-time reversal estimates are obtained from cycle analysis. An increasing use of EWT for structural analysis and the recent addition of CIT (Change In Trend) time slots has greatly improved the exact timing of reversals.
For a FREE 4-week trial, send an email to: [email protected]
For further subscription options, payment plans, weekly newsletters, and for general information, I encourage you to visit my website at www.marketurningpoints.com. By clicking on “Free Newsletter” you can get a preview of the latest newsletter which is normally posted on Sunday afternoon (unless it happens to be a 3-day weekend in which case it could be posted on Monday).
The above comments and those made in the daily updates and the Market Summary about the financial markets are based purely on what I consider to be sound technical analysis principles. They represent my own opinion and are not meant to be construed as trading or investment advice, but are offered as an analytical point of view which might be of interest to those who follow stock market cycles and technical analysis.

When Andre Gratian was a stock broker years ago, a friend introduced him to technical analysis of the market. Consequently, it is not an exaggeration to say that Andre fell in love with this approach! Ever since then, it has become an increasingly important part of his professional life. Gratian has studied the works of Wyckoff, Edwards & Magee, Edward J. Dewey (cycles) and many others. However, one of my most profitable undertaking has probably been to study Point & Figure charting, which he finds invaluable in analyzing stocks and indices. If he were restricted to one methodology, this is the one that he would choose. This well-rounded background has given him what he feels to be a special insight into the stock market, facilitating the recognition of meaningful patterns and the ‘turning points’ in all trends, whether they be short or long term. Andre feels very comfortable discussing the stock market and passing on meaningful information to others. His subscribers include individuals and money managers throughout the world. Moreover, his Newsletters are currently published on several financial sites, here and abroad.


