Maund On Gold


It is a tragic irony that at a time when gold and silver are completing large basing patterns after a long and deep correction, and are at last nearly ready to turn up and start their next major uptrends, most investors in the PM sector have been psychologically crippled and rendered impotent by huge losses – some have been ruined. Most investors in the sector, or would be investors, will therefore not partake in the PM sector’s next major upleg, and will stand idly by watching it from the sidelines. Not so Big Money which has been and is soaking up the better PM stocks like a giant sponge at knockdown silly prices.
Let’s now proceed to examine the evidence that the sector is ready is ready to begin a major new uptrend soon. We will start by looking at the long-term chart for gold.
On gold’s 14-year log chart we can see that, despite the severe correction since the August 2011 peak, gold still has not broken down from the large broadening uptrend shown. In the last update, posted on 6th October, we looked for the next major uptrend to begin almost immediately, having observed a large potential Head-and-Shoulders bottom completing. That pattern aborted and we were stopped out (of gold and silver) for a minor loss. Although that interpretation was invalidated, it still looks like gold is in a basing process, and it may be forming a Double Bottom with its June lows, even though it made a new closing low last week.
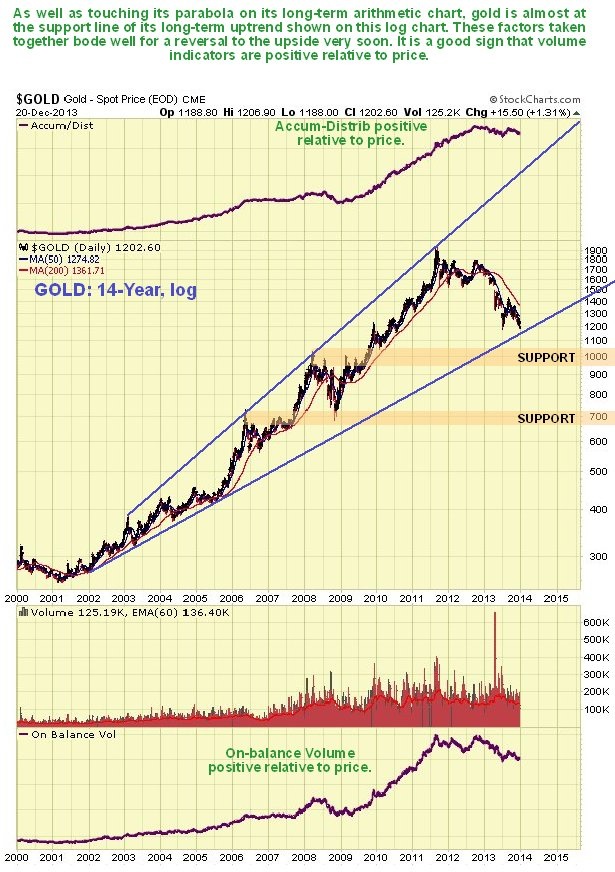
Some of you may have heard about Goldman Sachs recently calling for gold to drop further to the $1050 area. How likely is that? Well, it could happen, but if it does our chart shows that it will throw up a major opportunity because there is massive support centered on $1000 from the extensive trading in 2008 and 2009 at and below this price level. There are two possible interpretations regarding the underlying reasons for Goldman Sachs' prediction. One is that they have opened a big short position in gold, like they did before the Spring breakdown, and are trying to muscle gold down to that level so that they can exit the trade with a huge profit – this is more possible for them than for most banks because of the extraordinary power they exert over government and politicians etc. The other interpretation is they are trying to talk gold down in order to build up their inventory of gold related investments at knockdown prices.
A chart which suggests that gold’s correction is done and that it is ready to turn up immediately is the 20-year arithmetic chart, which shows that the price has now dropped back to meet the parabolic uptrend line that has supported the price from the start of the bullmarket. There is a chart doing the rounds which purports to show that gold has already broken down from a different parabolic uptrend by a big margin and is therefore in a bearmarket, but this chart is invalid because the parabola is skewed and not horizontal at its point of origin in 2001 as ours is. Our parabola certainly looks valid as in addition to being horizontal at its point of origin, it has supported the price at several key junctures.

There is no denying that gold’s shorter-term charts, like the 6-month chart shown below, look pretty grim, with downtrends in force and bearishly aligned moving averages, which implies that we may need to see a period of backing and filling before a major uptrend can get established, in order to allow time for moving average alignment to improve.

The latest COT charts for gold are super bullish, and make a strong case for a rally to get started before long. On the COT chart shown below we can see that the Commercials’ short positions in gold have dropped back to their lowest levels since at least 2004, so that they are now almost non-existent. They are on a par with their low level in June of this year, which preceded a more than $200 rally in gold. This is a very bullish setup indeed. This kind of indication doesn’t seem to have any effect on the average investor, who is simply too dumb to understand what it means. Even if he does, if it doesn’t produce the desired effects within days or weeks, he loses patience and quickly forgets about it. We are not going to forget about it.

Chart courtesy of www.sentimentrader.com
The Commodity COT Master Indicator for metals shows a similar situation, with readings for metals at their most bullish since 2008.
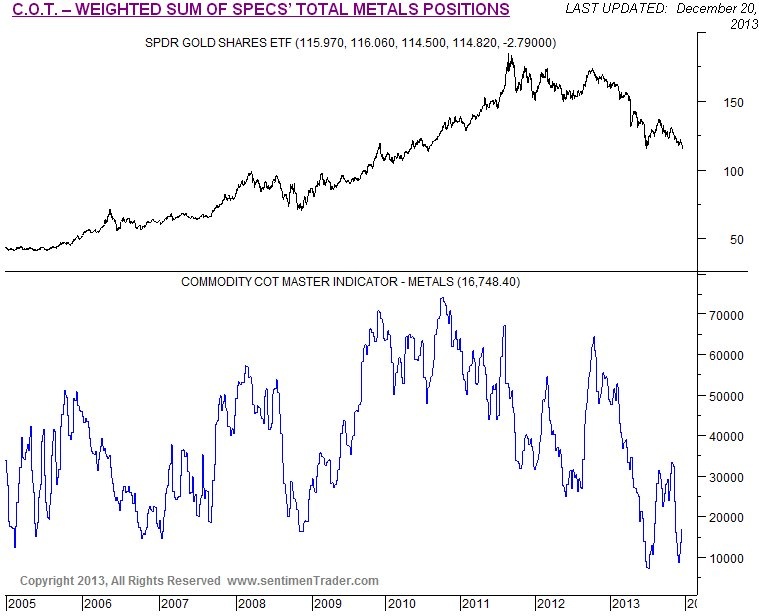
Chart courtesy of www.sentimentrader.com
The gold Public Opinion chart shows that gold is held in very low esteem by investors at this time which is bullish, although the reading is some way above the extremely low level plumbed in June of this year.

Chart courtesy of www.sentimentrader.com
Those indefatigable contrarian indicators, the Rydex traders, have reduced their Precious Metals holdings to extraordinarily low record low levels, way below the green buy line on the chart shown below. This is most encouraging or should be for new gold and Precious Metal sector bulls.
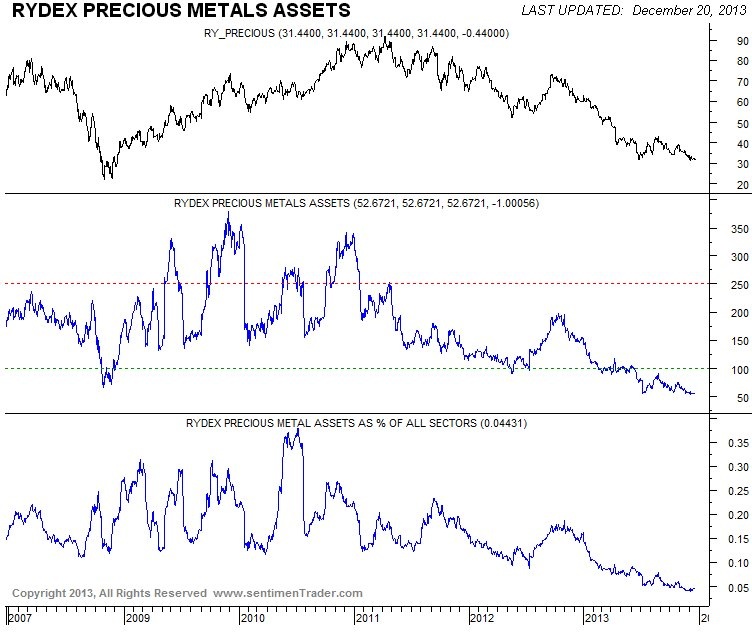
Chart courtesy of www.sentimentrader.com
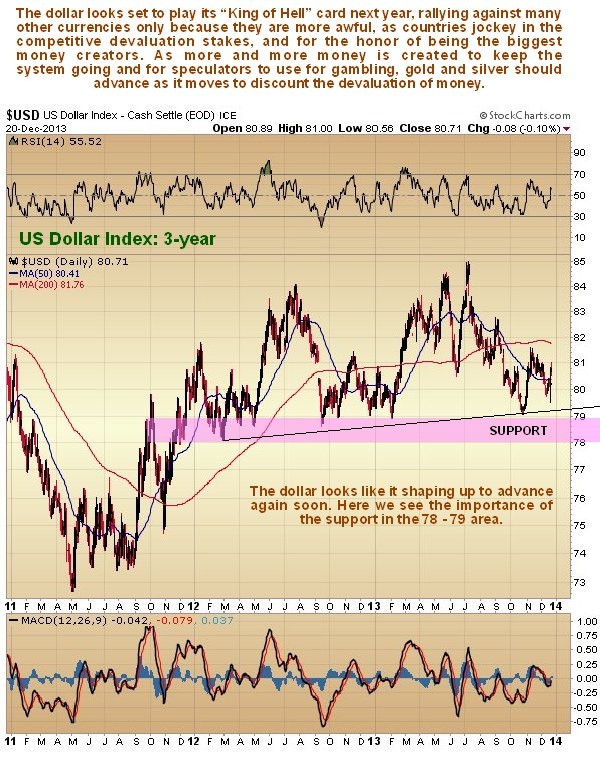
The dollar meanwhile looks like it shaping up to advance against many other currencies, not for intrinsic reasons but more because other currencies are being subject to even more abuse. On the 3-year chart for the dollar index we can see that it is in a good position to rally away from the strong support in the 78 – 79 area. This support is very important – if it fails the dollar would likely drop down to the low 70’s, but it doesn’t look like it will fail in the foreseeable future.
The dollar COT looks quite strongly bullish, with the Commercials going long after being short for a long time, and the Large Specs, who are usually wrong, doing the opposite. Large Specs have swung quite dramatically from long to short in recent weeks. This suggests a dollar rally, which of course may be triggered by more euro weakness. This does not affect the bullish outlook for gold, as there are circumstances in which the dollar and gold can rally together, although a short-term dollar rally may coincide with a gold dip into a final low.

Chart courtesy of www.sentimentrader.com
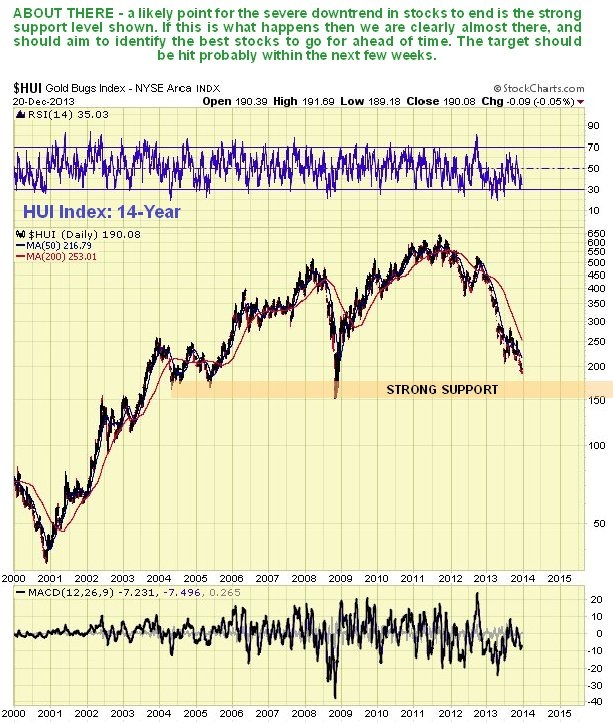
Precious Metals stocks appear to be approaching an important downside target at the zone of strong support shown on our 14-year chart for the HUI index below. They are getting close to this target now, so this is a good time to sort out the better ones to go for once the target is hit or a convincing reversal occurs.
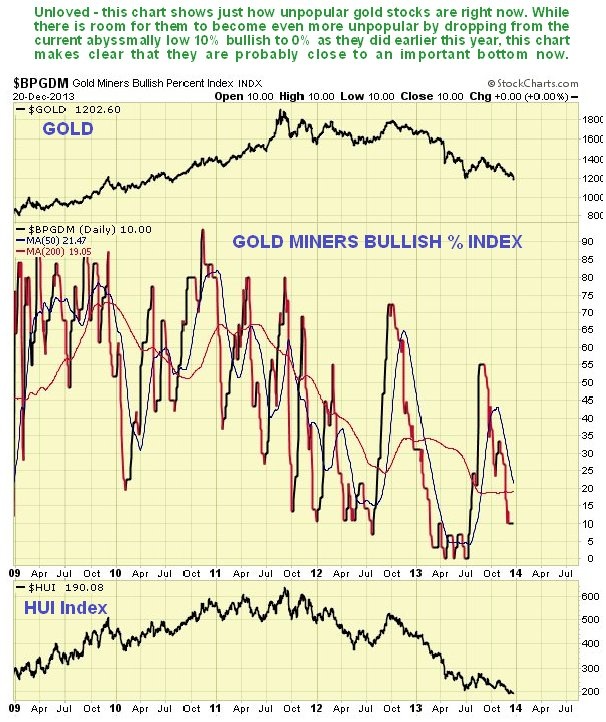
The extreme negative sentiment towards gold stocks is made plain by the Gold Miners Bullish Percent Index shown below. This sort of negativity is bullish for PM stocks.

Clive P. Maund’s interest in markets started when, as an aimless youth searching for direction in his mid-20’s, he inherited some money. Unfortunately it was not enough to live a utopian lifestyle as a playboy or retire very young. Therefore on the advice of his brother, he bought a load of British Petroleum stock, which promptly went up 20% in the space of a few weeks. Clive sold them at the top…which really fired his imagination. The prospect of being able to buy securities and sell them later at a higher price, and make money for doing little or no work was most attractive – and so the quest began, especially as he had been further stoked up by watching from the sidelines with a mixture of fascination and envy as fortunes were made in the roaring gold and silver bull market of the late 70’s.
Clive furthered his education in Technical Analysis or charting by ordering various good books from the US and by applying what he learned at work on an everyday basis. He also obtained the UK Society of Technical Analysts’ Diploma.
The years following 2005 saw the boom phase of the Gold and Silver bull market, until they peaked in late 2011. While there is ongoing debate about whether that was the final high, it is not believed to be because of the continuing global debasement of fiat currency. The bear market since 2011 is viewed as being very similar to the 2-year reaction in the mid-70’s, which was preceded by a powerful advance and was followed by a gigantic parabolic price ramp. Moreover, Precious Metals should come back into their own when the various asset bubbles elsewhere burst, which looks set to happen anytime soon.
Visit Clive at his website: CliveMaund.com


