The Most Equitable Measure Of Stock Market Valuation Is Market Cap/GDP


Today’s stock valuation is more grossly exaggerated and unrealistically inflated than in the 1920s. Historic testament suggests today’s pie-in-the-sky lofty stock prices are irrational and driven by the artificial force of the Fed’s QE…and fueled by illogical investor complacency.

 The world’s richest man, multi-billionaire Warren Buffett, once observed that the best metric for determining the level of stock market’s valuation is the Market Cap/GDP ratio. And market sage Buffett ‘outta’ know as he made all his billions in the stock market.
The burning question today in the minds of institutional investors worldwide is:
“What is the Market Cap/GDP ratio suggesting today” as the Dow and S&P500 Indices are churning at all-time record highs?”
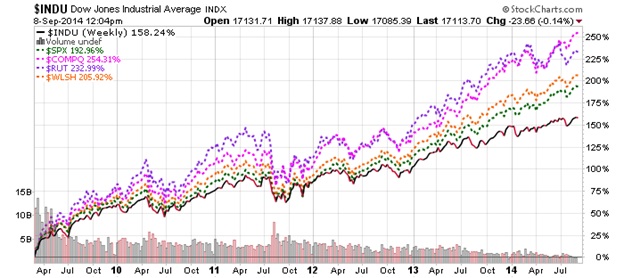
To objectively answer this provocative question, we need to analyze what stocks have done since early March 2009, when the US Fed initiated Quantitative Easing (QE) with a view to avert a stock market meltdown similar to the 1929 Stock Crash. The chart below shows the Performance (i.e. appreciation) of US major stock market indices (Dow, S&P500, NASDAQ, Russell 2000 & Wilshire 5000 Indices).
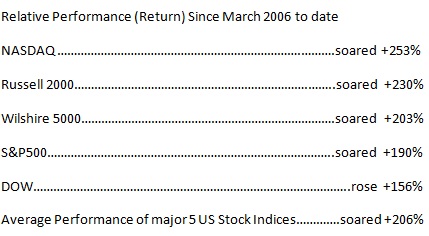
And an increase of +206% during this period is equivalent to a Compound Annual Growth Rate (CAGR) of an astounding +25 PERCENT. This is an almost unprecedented price gain in US history.
Compare the above to the infamous Roaring 1920s (1922-1929):
“From 1922 to 1929 stocks rose in value by 218.7%. This is equivalent to an 18% annual growth rate in value for the seven years (Source: The 1929 Stock Market Crash )
It is frightenly clear to any objective analyst and/or intelligent investor that the present bull market rally in stocks (2006-2014) is past the pale…i.e. the excess valuation is dangerously and scaringly above the market excesses of the 1920s…just before the stock market crash “From 1929 to 1932 when stocks lost -73% of their value. The price increases were large, but not beyond comprehension…which led to the 1930s Great Depression.”
Now let’s focus on market guru Buffett’s favorite metric for determining Stock Valuation.
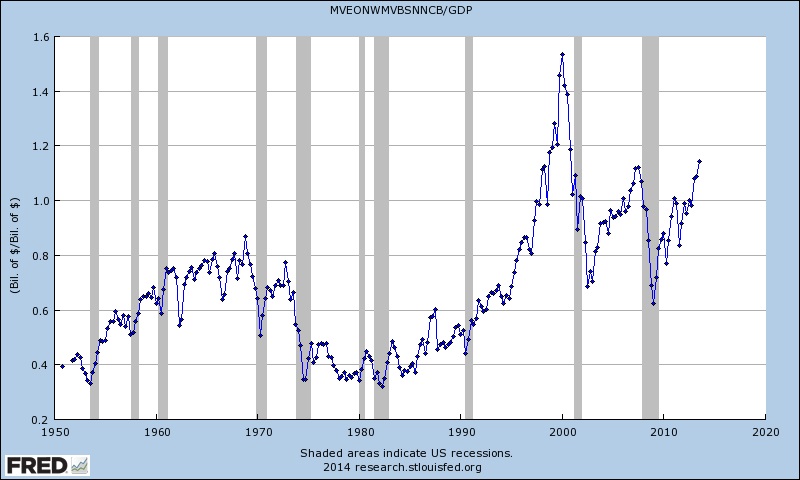
Market Analyst Doug Short created the following two charts for the Buffett Indicator.” Mr. short made the following statement:
“The raw data for the "Buffett indicator" only goes back as far as the middle of the 20th century. Quarterly GDP dates from 1947, and the Fed's B.102 Balance sheet has quarterly updates beginning in Q4 1951. With an acknowledgement of this abbreviated timeframe, let's take a look at the plain vanilla quarterly ratio with no effort to interpolate monthly data or extrapolate since the end of the most recent quarterly numbers. Here is a chart I created using the Federal Reserve Economic Data (FRED) data and charting tool.”
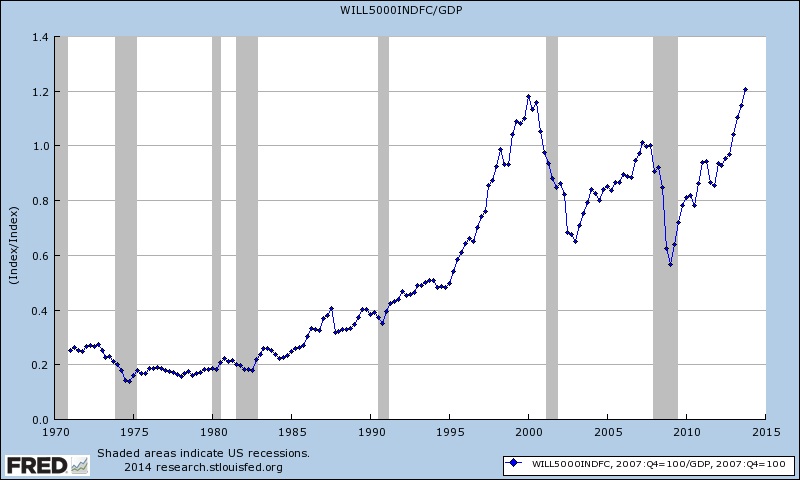
Analyst Short goes on to say: “For those of you who may have reservations about the Federal Reserve economists' estimation of Market Value, I can offer a more transparent alternate snapshot over a shorter timeframe. Here is the Wilshire 5000 Total Market Full Cap Index divided by GDP, again using the FRED repository charting tool.”
What Do These Charts Tell Us?
According to Doug Short: “Both the "Buffett Index" and the Wilshire 5000 variant suggest that today's market is at lofty valuations. In fact, the latest quarter in the Wilshire version is the third highest in its history, fractionally topped by two quarters in 2000.”
Prudent investors should beware of a possible stock market crash brewing on the horizon…which may be the prime reason why billionaire Warren Buffett’s flagship (Berkshire Hathaway) has an all-time record $57 Billion Cash Hoard. Perhaps this is the reason for Buffett’s sardonic smile in the photo at the beginning of this editorial.
Related Readings & References:
Blue Skies and Market Blues (1929 & 2000)
Bear Markets of the Past 100 Years
Stock Market Forecast By Market Cap/GNP Ratio
Annual Returns on Stock, T.Bonds and T.Bills: 1928 – Current :
http://pages.stern.nyu.edu/~adamodar/New_Home_Page/datafile/histretSP.html
********


