November 2002; A Key Month for the Gold Market


The Dow Jones closed up this week, making another approach to break above its BEV -5% line below, something it has failed to do since last November, in the circle below. But will it break above it this time?
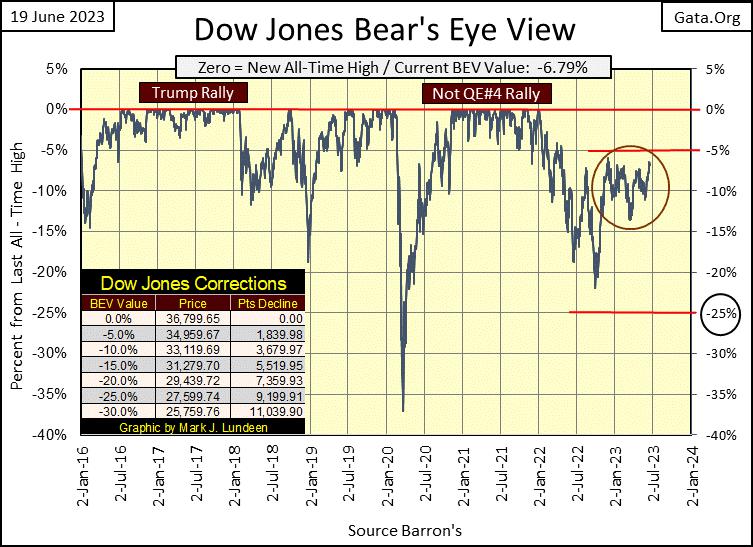
It could. But up here in the market’s peanut gallery where I’ve been hanging out for the past few years, there aren’t many beers or hotdogs being bet on this; that the Dow Jones will, or will not break above this critical level. It’s like no one hanging out in the peanut gallery really cares one way or the other, if the Dow Jones makes one another new all-time high, or not.
Here is what everyone is betting their beer on; if sometime in 2023, Mr Bear claws the Dow Jones back below its lows of March 2020 in the chart below. The bet isn’t that the 18,951 close of 23 March 2020 (BEV -38% in BEV chart above), will or will not be taken out. The assumption is that it will. The bet is whether Mr Bear does so before 01 January 2024, or after.
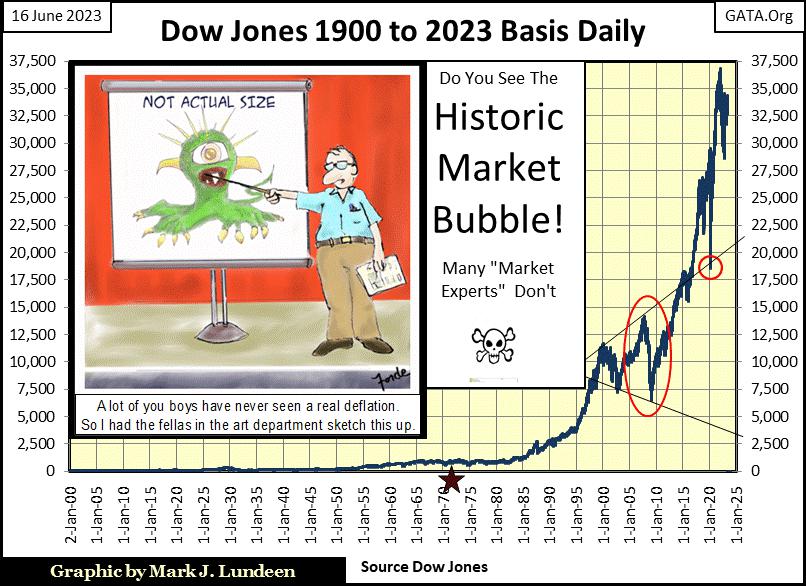
What do I think? I think, thinking about what the Dow Jones is going to do next, is a good way of getting a headache. I also think it is unwise risking one’s beer on wild speculations on the market. Looking at the last 123 years of the Dow Jones in the chart below, seeing Mr Bear claw back the Dow Jones below its lows of March 2020 (the little red circle) is not so much a sure thing – as it is unavoidable. But risking a beer on whether this massive claw back is before or after 01 January 2024, makes me uncomfortable.
Sometimes I get prickly with the guys up here in the peanut gallery, as they don’t understand me. Is that a crime? No, but maybe it should be. Anyway it’s; “hey pal, touch me again and I’ll hurt you,” or it’s “hey buddy, who are you talking to, are you talking to me?”
https://youtu.be/lQkpes3dgzg?t=49
Yeah, I’m a real joy to be sitting next to here in the bleachers, high above the market. But it’s not my fault. It’s this waiting for the stock and bond markets to crash, and gold, silver and their miners to do something spectacular, is beginning to wear on me. Seeing gold closing over $3000, and silver over $100, and I’ll become a real pussycat once again.
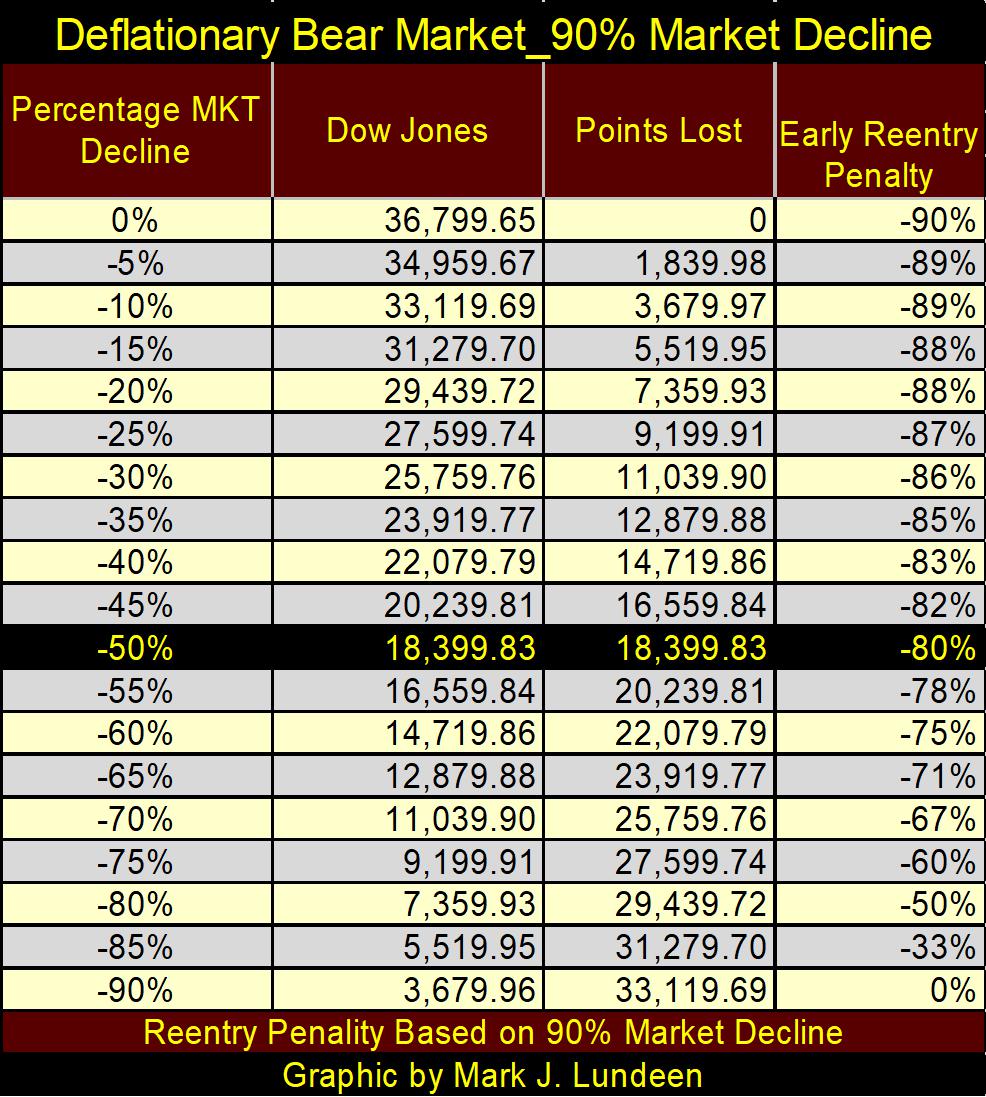
But that didn’t happen last week. So, I tell myself it’s okay, that no matter how badly I bruise my fellow creature’s bodies and minds, I’m still the biggest victim up here in the market’s peanut gallery. How could I not be, after looking at the table below, where a Dow Jones’ claw back by Mr Bear below the close of 23 March 2020, a 50% market decline, only results in growing terror when I consider what happens after that?
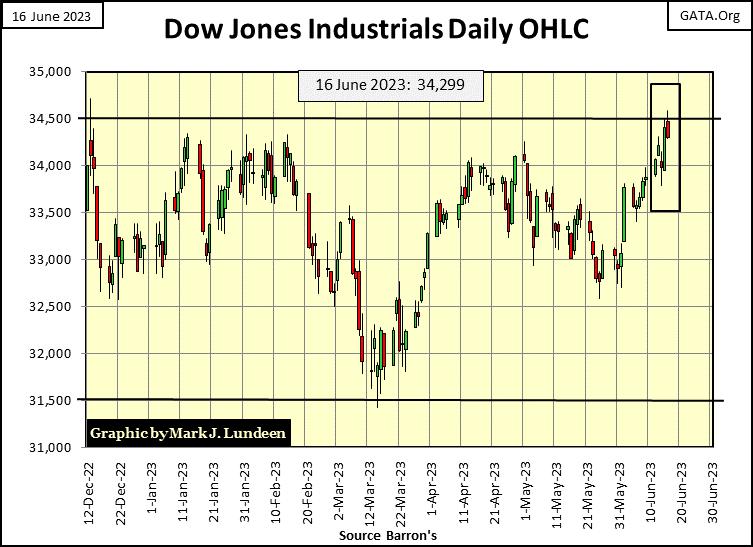
But at the close of this week in June 2023, we’re not there yet. Not with the Dow Jones making yet another attempt at closing above 34,500; something it has failed to do since last November. So, will it be in June 2023 that the Dow Jones finally breaks above, and then stays above 34,500? Your guess is as good as mine. And yes, it’s only a guess that it will or will not in the weeks to come.
Moving down to the major market’s BEV value table below, everything advanced this week, and that is a good thing, I guess.
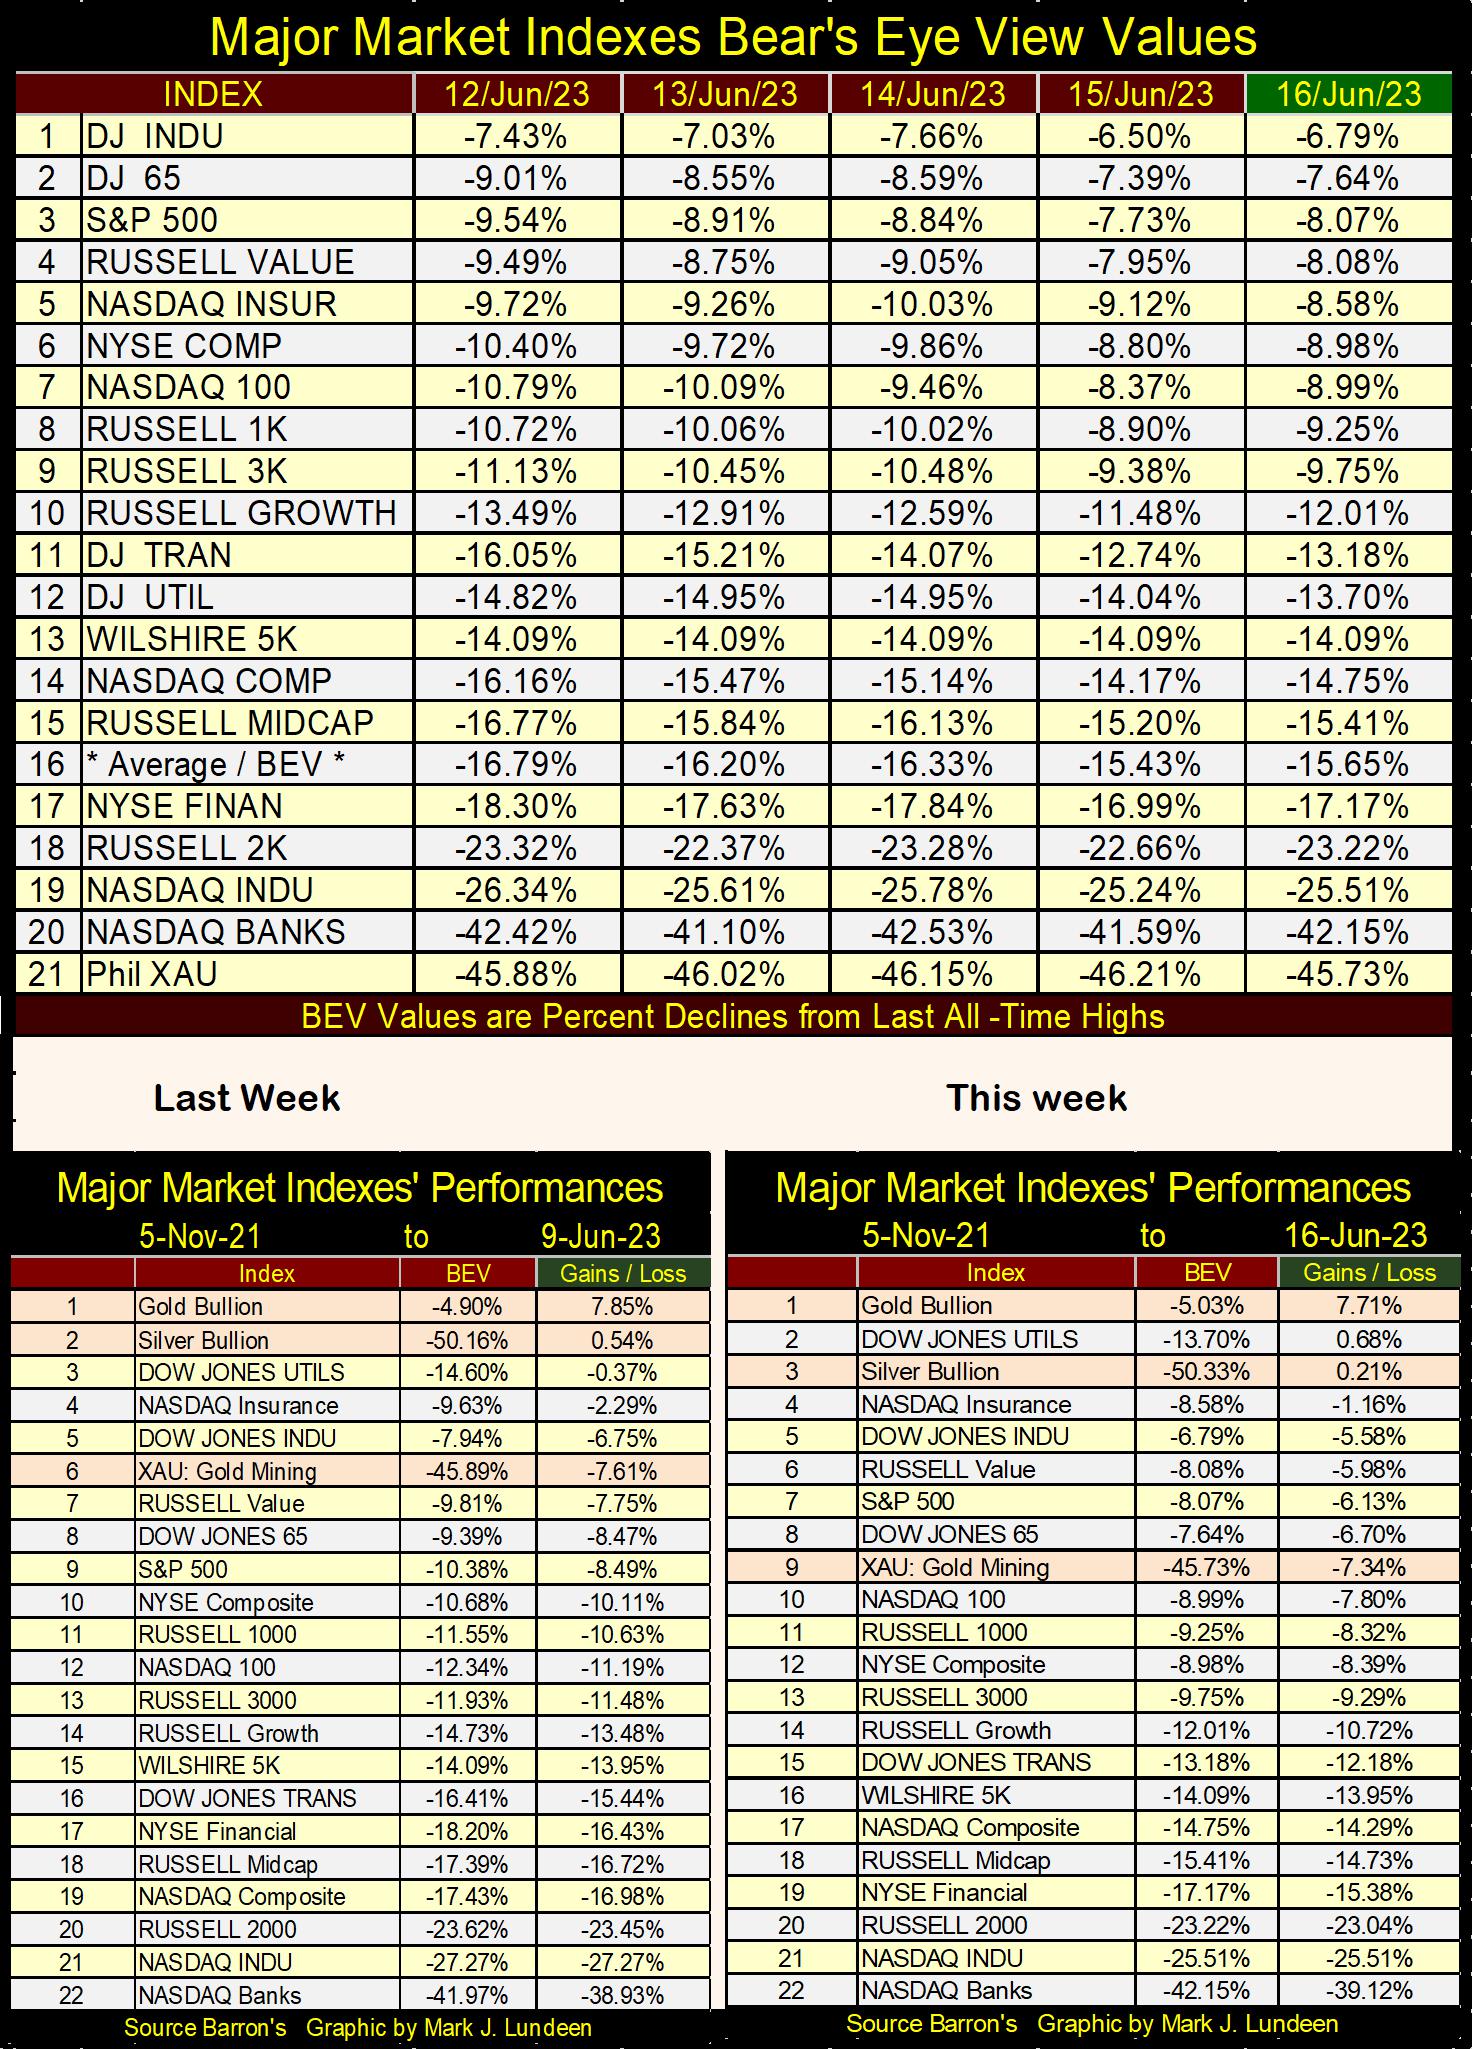
In the performance table above for this week, the XAU (#9) was actually up, but slipped in the ratings as other indexes advanced more than did the gold miners. Gold bullion has been #1 for a while; I think for a few months now. I like that.
NYSE 52Wk H-L Nets below have gone positive beginning in June, and we see some triple-digit H-L Nets in the past two weeks.
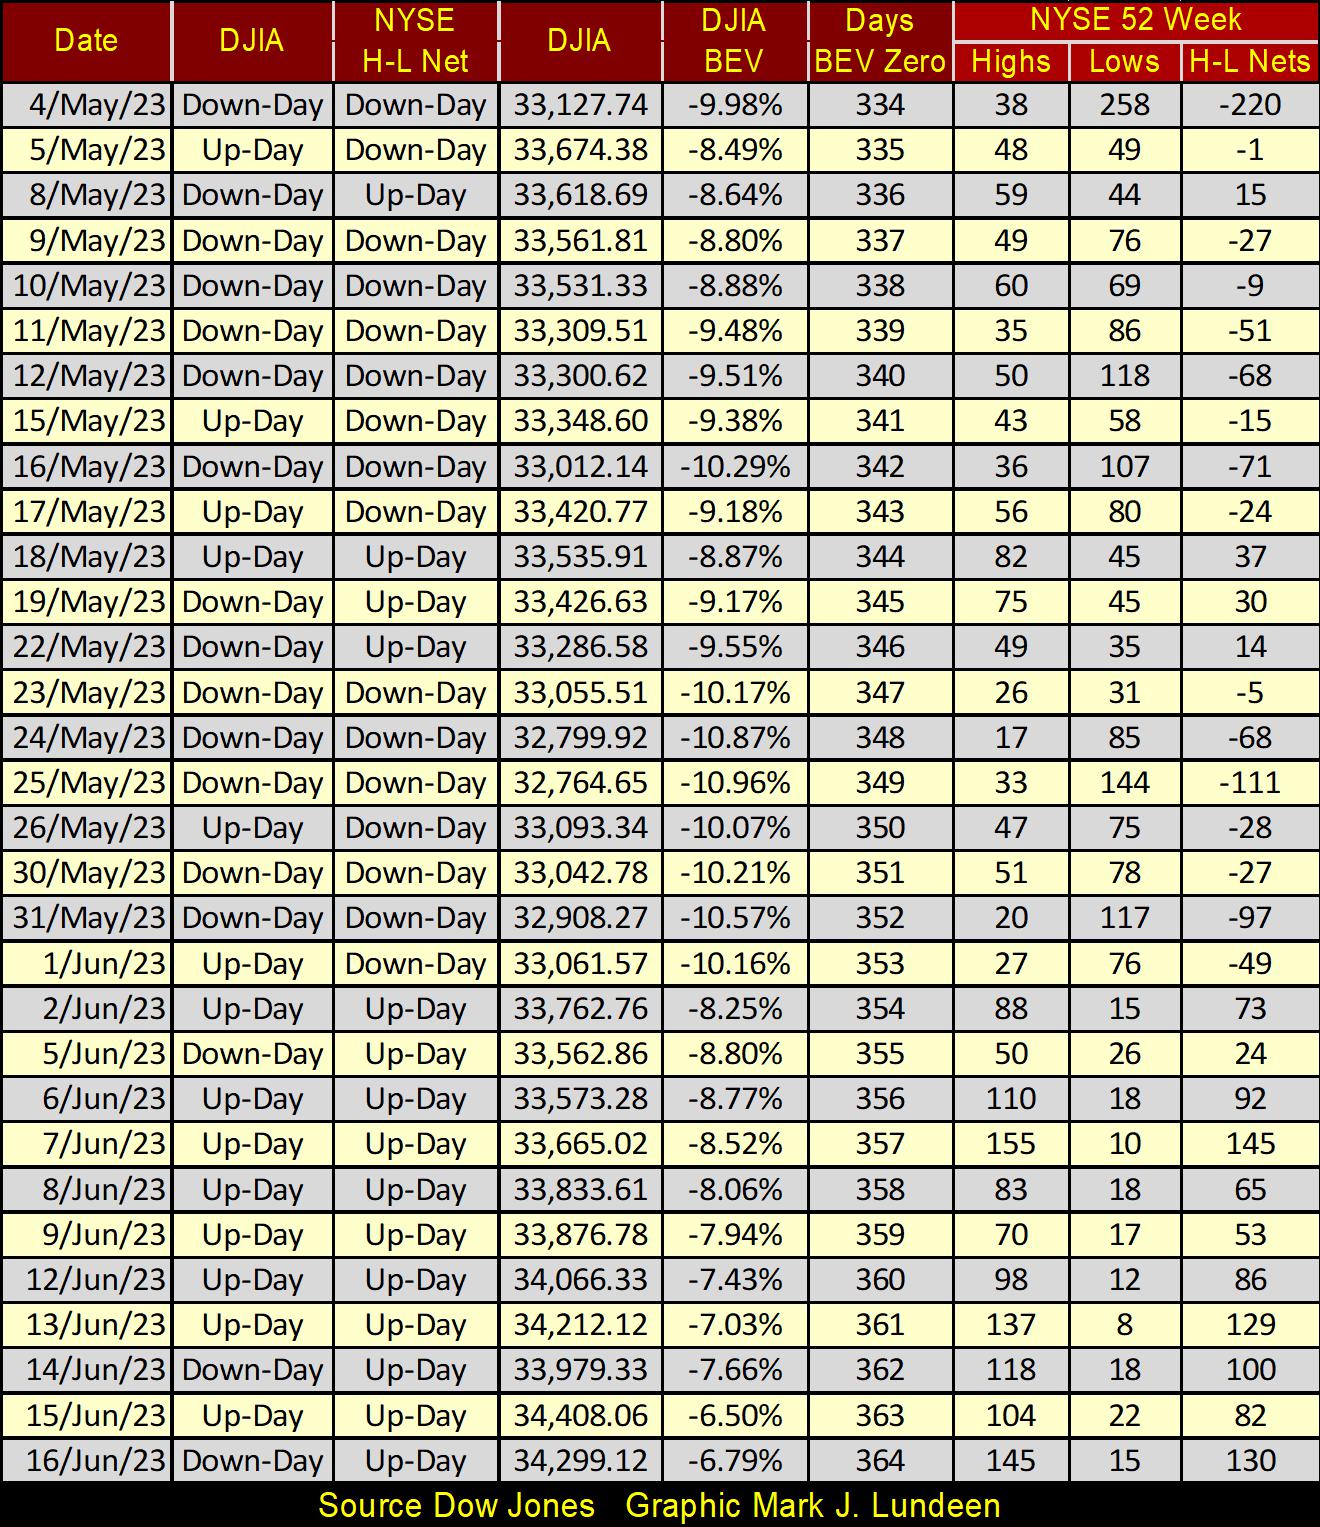
One thing is certain; in a bull market, the NYSE sees more 52Wk Highs than Lows, and that is what we’ve been seeing since the first of June. But if you look at the Days BEV Zero column, on Friday it closed at 364, meaning since 04 January 2022, when the Dow Jones saw its last all-time high, the NYSE has seen 364 trading sessions.
For a normal correction in a bull market, that seems an excessive amount of time to have passed from one new all-time high to another, and after all this time, we’ve still not seen a new all-time high. Is the stock market in a bull market? I don’t think so, but I get the feeling most retail investors do. Why would anyone be in the stock market if they didn’t believe they were in a bull market?
Maybe because after over four decades of seeing the stock market advance, investors have developed certain bad habits and false beliefs. Like the Dow Jones, my proxy for the broad market, always recovers following massive market declines. It always has before, but will it the next time? Again, your guess is as good as mine.
As a generator of weekly market commentary, it’s best I don’t beat a subject to death before my readers. As I’ve been covering trends in long-bond yields and the price of gold quite a bit lately, I thought I’d give it a rest for a while. Then I saw a “market expert” on TV, misinforming a trusting public that if the idiots at the FOMC raise their Fed Funds Rate, that would be bearish for gold. It was then I understood, if there ever was a subject that needed to be beaten to death, without mercy, with my readers exposed to all the gruesome details, it was this rising bond yields / interest rate are bad for gold thing.
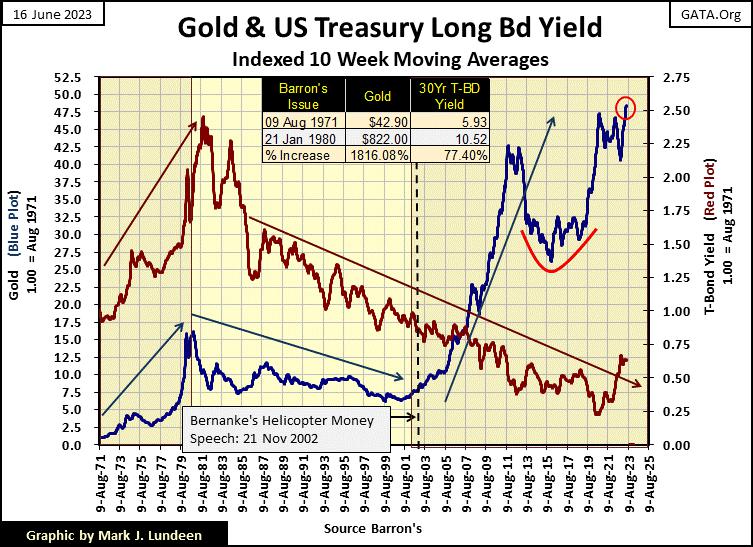
That being so, I’m breaking out the big guns this week with the chart below, plotting 10Wk M/As of the indexed value for the US Treasury’s long-bond yield (Red Plot), and the price of gold (Blue Plot), going back to August 1971, when the dollar was decoupled from its $35 gold peg.
There isn’t much to comment about the 1970s; as the price of gold increased during this decade, so did bond yields. That implies rising bond yields were a reaction to rising gold prices; is that true? Maybe, and then maybe not. More likely, the rising of both of these plots were a reaction to the inflationary increases in the volume of dollars being “injected” into the financial system by the idiots at the FOMC.
Here is a little detail I’ve discovered in my market research; periods of rising CPI inflation can be identified by observing bond yields, as rising bond yields = rising CPI inflation, as declining bond yields = declining CPI inflation.
More specifically, rising bond yields indicates “injected liquidity” from the FOMC is flowing into the consumer goods and services that comprise the Consumer Price Index. The bond market’s response to rising CPI inflation, the devaluing of the dollars bonds are valued in, is to increase yields, as bond valuations deflate.
Declining bond yields indicates that “injected liquidity” from the FOMC is flowing into Wall Street, creating booms and busts in stocks, bonds too, and real estate valuations.
In the chart below, think of trends in the price of gold being a proxy for CPI inflation. So, from the early 1980s, for the next four decades, long-term T-bond yields declined from 15.04% in September 1981, to 1.20% in Augusts 2020, as the price of gold bottomed in a massive bear market, ending in August 2020.
* Lundeen, can’t you read your own chart? That isn’t what happened, not even close! *
Okay, it didn’t happen that way, but should have been based on the trends seen above from August 1971, to 2002; where for thirty-years, trends in the yield for long-term T-debt and the price of gold, trended together.
In 2002, gold decoupled from its thirty-year relationship with bond yields. Thirty-years is a long time. Beginning in 2002, why did trends in gold for the next twenty years, become independent from trends in the long-bond yields above? Chris Powell from GATA, who around this time (2002?) said: “There are no free markets anymore, only market manipulations.”
And how right he was, and that is what I expect we’re seeing above; where since 2002, the price of gold advanced as the volume of dollars circulating in the economy increased, while bond yields continued trending down until August 2020, as they were manhandled downward by the FOMC.
In the chart above, a vertical dashed line notes when one idiot from the FOMC, one Doctor Ben Bernanke, gave a speech that was widely publicized by the main-stream financial media at the time.
At the time, November 2002, the markets, and the public were still in shock over the bust in the high-tech boom Alan Greenspan inflated during the 1990s. And the bust in high-tech was massive. The glamor issues of the 1990s boom, those can’t lose stocks everyone had to own (#90 to #99 in the table below), deflated 70% to over 90% from their highs of March 2000; Ouch! Like the Great Depression Crash of the 1930’s, the High-Tech Wreck of the 2000’s saw its suicides too.
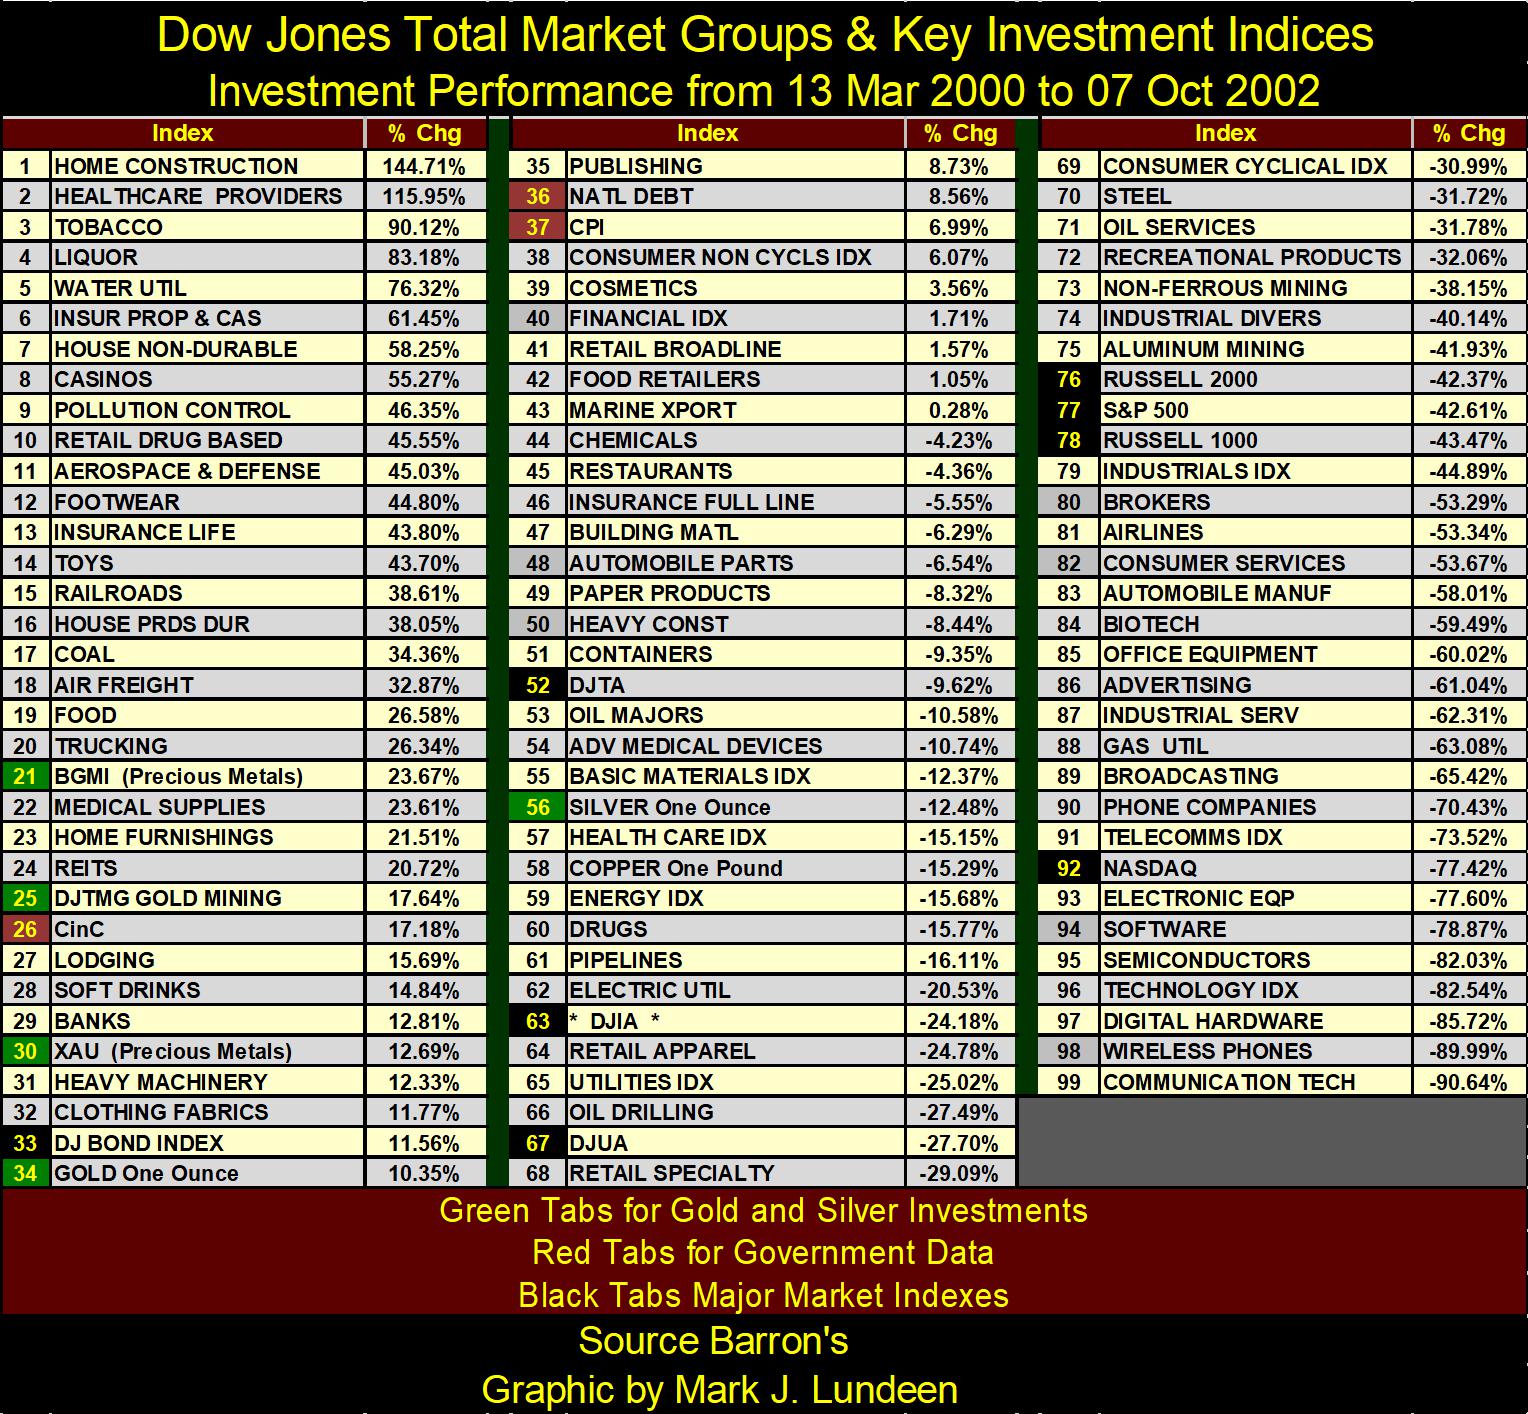
The sub-prime mortgage bubble had only begun (#1 in the table above), their new sub-prime mechanism, where the “policy makers” would use mortgages to “inject liquidity” into the financial system. They were going to reflate market valuations, one way or another, come hell or high water, whether Mr Bear approved of them doing so, or not.
This was the market context, when Doctor Bernanke said the following concerning deflation:
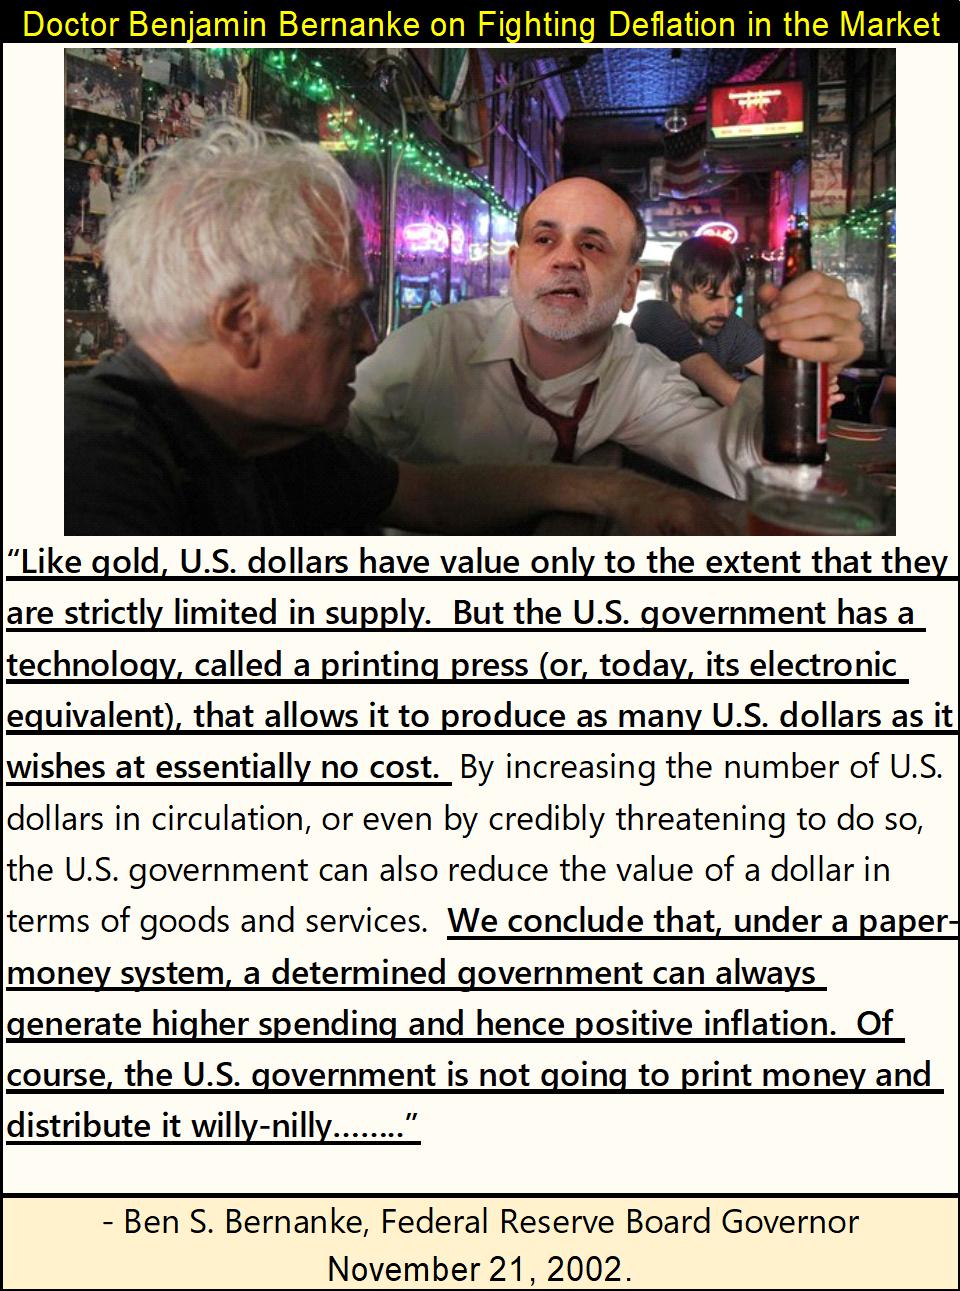
Look at the middle segment of the above quote, the segment that isn’t highlighted, where Doctor Bernanke admits that the FOMC can, does and promises it will “reduce the value of a dollar in terms of goods and services.”
Whiskey – Tango – Foxtrot, who do these people think they are, and where do they come from? Somewhere they weren’t taught the difference between right or wrong, places like Harvard, Yale and Princeton. Why is it the Federal Government subsidizes “higher-education” with its school loan program when higher education’s main output is immoral narcissists?
This speech was much publicized by the media in November 2002. I saw it on the local TV nightly news. It was such a hit with everyone who mattered, and didn’t matter, that Doctor Bernanke became Alan Greenspan’s replacement as Chair of the FOMC in March 2006. Should we be surprised how after this speech in November 2002, the thirty-year relationship between bond yields and the price of gold was abruptly terminated in the chart above, as gold advanced ahead of bond yields by two full decades?
As noted by Doctor Bernanke above: “Like gold, U.S. dollars have value only to the extent that they are strictly limited in supply. But the U.S. government has a technology, called a printing press (or, today, its electronic equivalent), that allows it to produce as many U.S. dollars as it wishes at essentially no cost.
So, since November 2002, how many dollars has the US Government created at no cost to itself? That can be seen in the table below, government data as published in Barron’s.
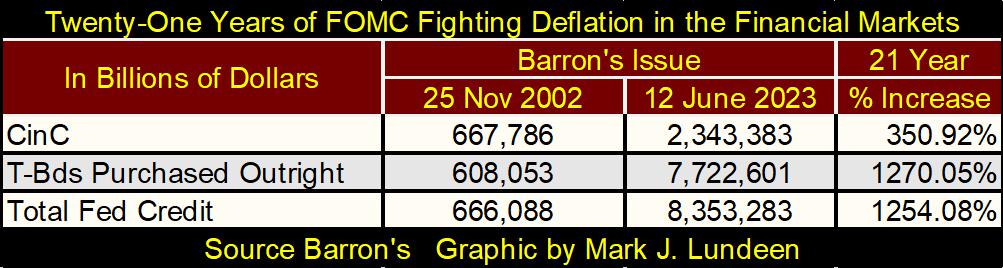
This idea of dollars being created at “no cost” is a fiction appreciated by only those at the highest levels of “policy making.” For those who go to work every day to earn their dollars, the cost of this monetary inflation has been onerous, and has been for many decades.
We should note the US national debt broke above $32 trillion this week. It won’t be long before it breaks above $33 trillion, which will flood the Treasury Bond Market with an ever larger supply of Uncle Sam’s IOUs.
Increases in supply in any market results in lower prices, and lower prices in the bond market results in rising yields. It’s only a matter of time before bond yields once again begin rising towards double-digits, and trends in the price of gold and bond yields once again recouple – upwards. What price will gold be then? Much more than it closed at this week ($1957.72).
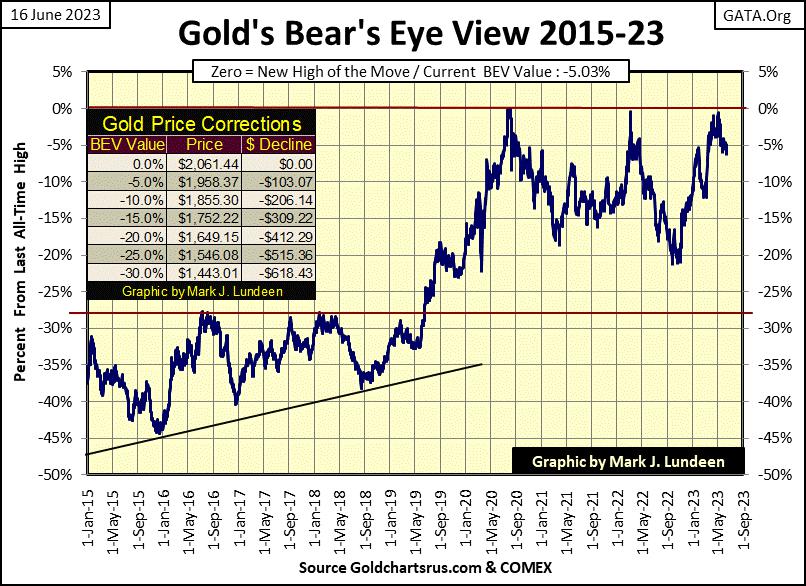
How did gold do this week? Not bad for a market with an elephant sitting on it. In its BEV chart below, it closed the week just out of scoring position. So, when are we going to see gold do some “down field running,” as we say in American Football when a running back is taking the ball down towards the goal line for a touchdown.
Hey, I’m out of the prediction business. I know what is going to happen. It’s the thinking I know when that I begin having problems with my market opinions. Sometime in 2023? Sure, why not?
I’ll say this; the key to the future for the stock and gold markets is to be found in the bond market. When bond yields once again begin advancing towards double-digits, the stock market is going to crash, as the stock market is only a giant, ever growing boil of monetary inflation waiting for rising bond yields to lance it. The effects of rising bond yields on the gold and silver market will be very different; rising yields will result in the old monetary metals, rising upwards toward historic highs.
Keep in mind the ounces of gold and silver, from 1970 to today, are unchanged. If gold was trading for $43.50 in August 1971, but over $1900 in June 2023 it’s because of the mismanagement of the dollar by FOMC, working on behalf of the Federal Government.
And everyone involved in devising and executing “monetary policy” at the FOMC, knows exactly what they have done to the dollar, and its future ramifications to the economy, the banking system, and society as a whole. You can too by reading about John Law and his Mississippi Scheme Bubble from 18th century France.
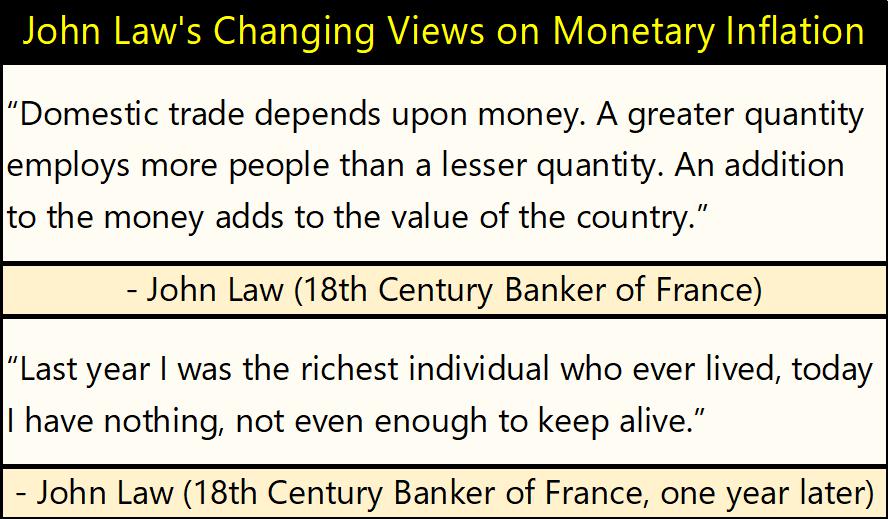
So, what these people have done, and continue doing is nothing new. All pending social-economic destruction coming our way, was done the old fashion way, by first decoupling a national currency from gold and silver, and then begin printing it with ink on paper, or its electronic equivalent as Doctor Bernanke told us.
And now these same people want to issue a cyber currency, controlled by them. Be afraid, be very afraid should that become our monetary reality, as these people will have no pity for you, or your children should that happen.
Not much going on in either gold’s or the Dow Jones’ step sum tables below. Since May 12th gold is down 2.65% as its step sum remained unchanged at 299. Bull markets in gold are volatile markets. When gold finally makes its move, its daily volatility’s 200Dy M/A will rise up to, and exceed 1.0%. That daily volatility has been stuck at 0.74% for quite a long time, tells us gold has yet to make its move on its last all-time highs of August 2020 ($2061).
So far in 2023, gold has seen only one day of extreme volatility, which for gold is a +/- 3% move from a previous day’s closing price. Silver has seen three days of extreme volatility, which for silver are +/- 5% daily moves.

When gold and silver make their big moves into market history, into values far above their last all-time highs, in a six-month period we’ll see many more +/- 3% (gold) and +/-5% (silver) daily moves in the old monetary metals. Until we do, I expect we’ll just have to endure the mediocre markets we’ve seen for quite a long time now.
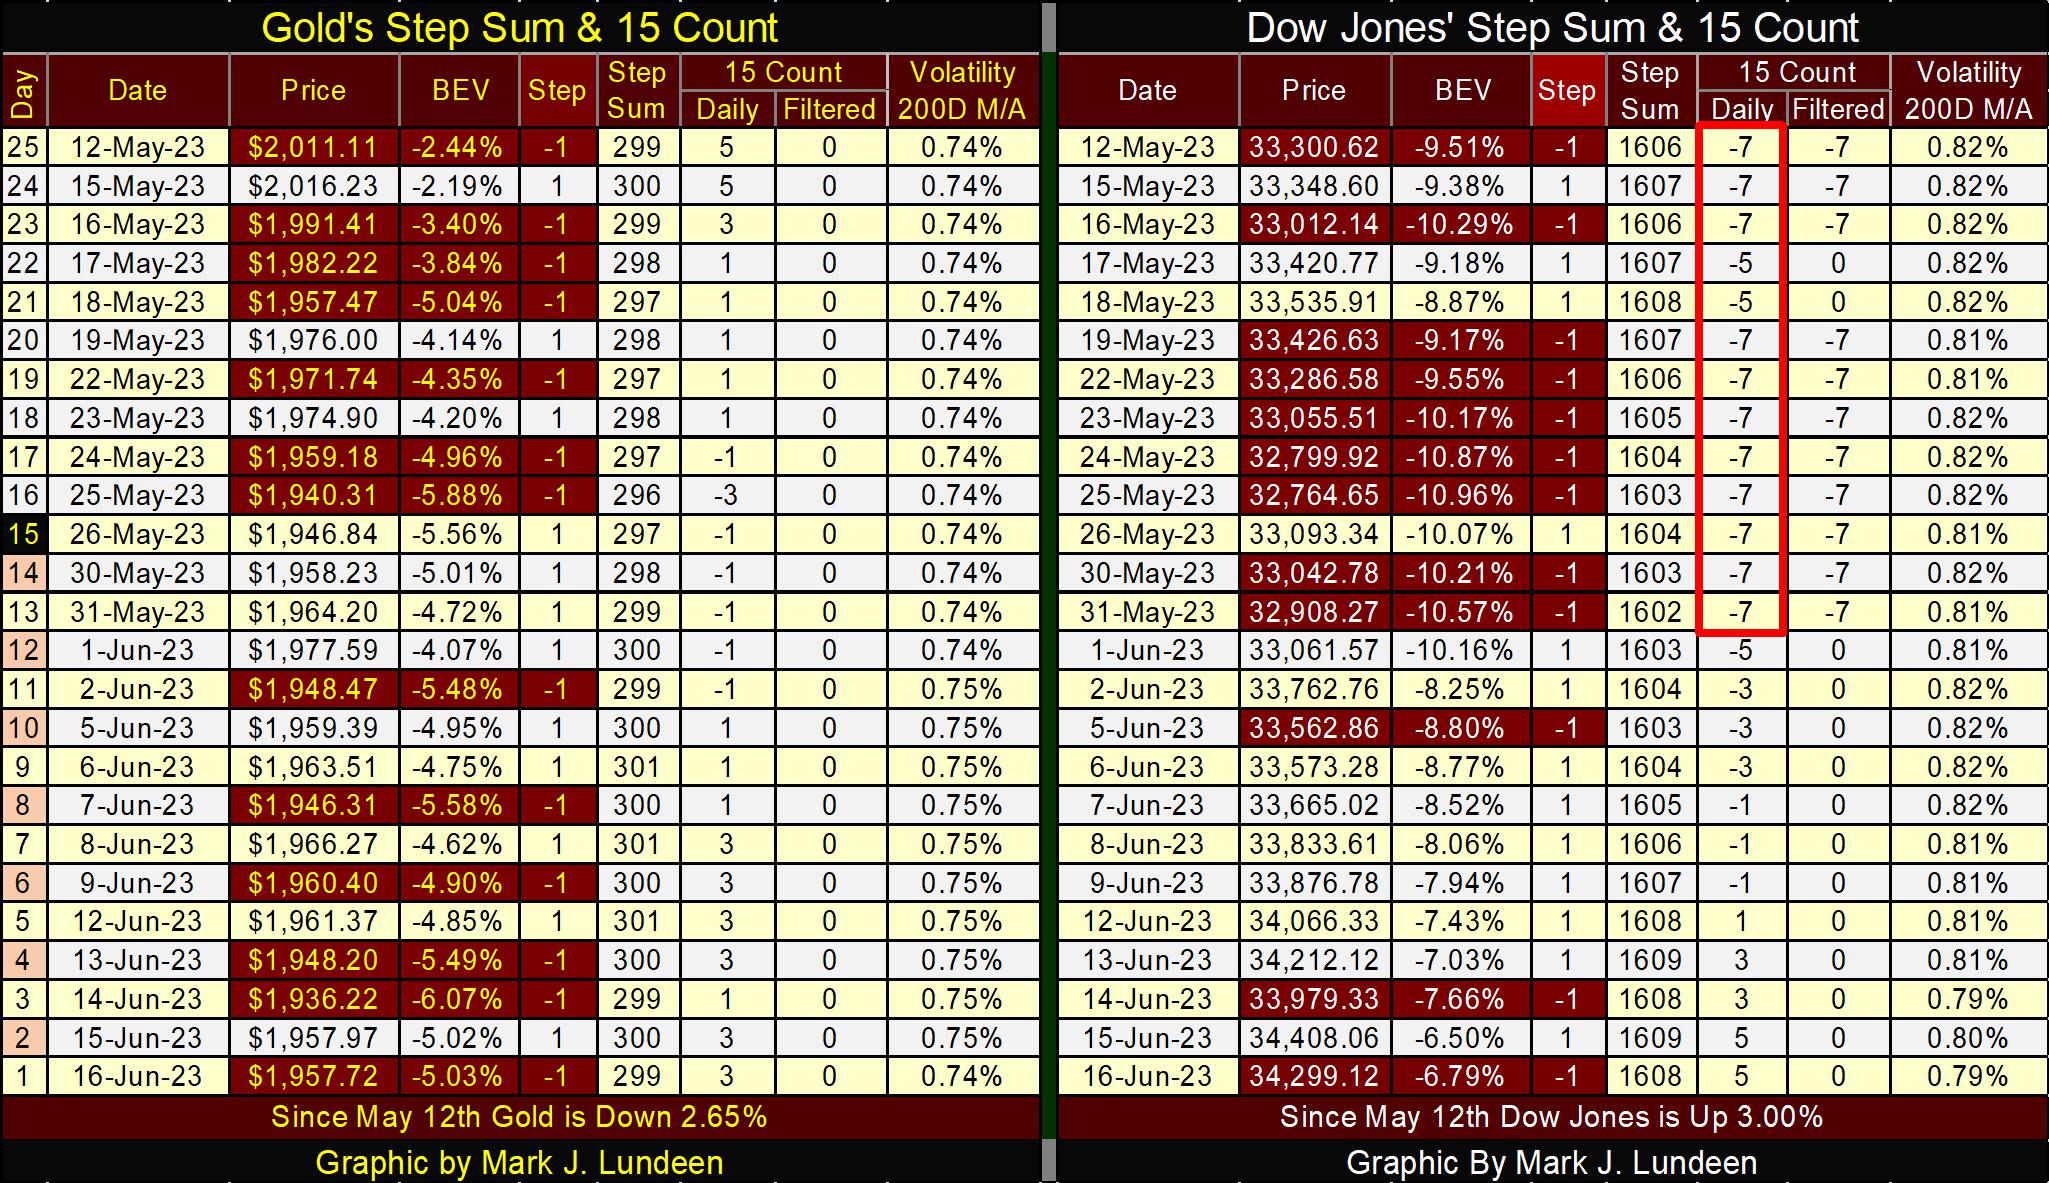
The Dow Jones was an oversold market for most of May. It saw many 15-counts of -7, and as markets don’t like being oversold, we shouldn’t be surprised seeing the Dow Jones advancing nicely since the beginning of June. Daily volatility’s 200Dy M/A has declined to 0.79%, that is bull market friendly, as bull markets in the stock market are low volatility markets, and always have been. Seeing daily volatility rise up towards 1.00%, is a warning that for the stock market, something bad looms somewhere over the horizon.
Mark J. Lundeen
********


