Oil Trading Alert: Gold And Oil Link - What Does It Say?


Trading position (short-term; our opinion): Short positions (with a stop-loss order at $56.45 and an initial downside target at $45.81) are justified from the risk/reward perspective.
On Monday, crude oil lost 1.52% after oil investors reacted to Friday's Baker Hughes' report, which showed that U.S. drillers added 17 rigs, which was the 13th increase in the past 14 weeks. Thanks to this news light crude reversed and declined to the previously-broken short-term support/resistance line. Will it manage to stop oil bears in the coming days? Is it possible that the relationship between gold and crude oil give us more clues about oil's future moves?
Let's examine the charts below to find out (charts courtesy of http://stockcharts.com).
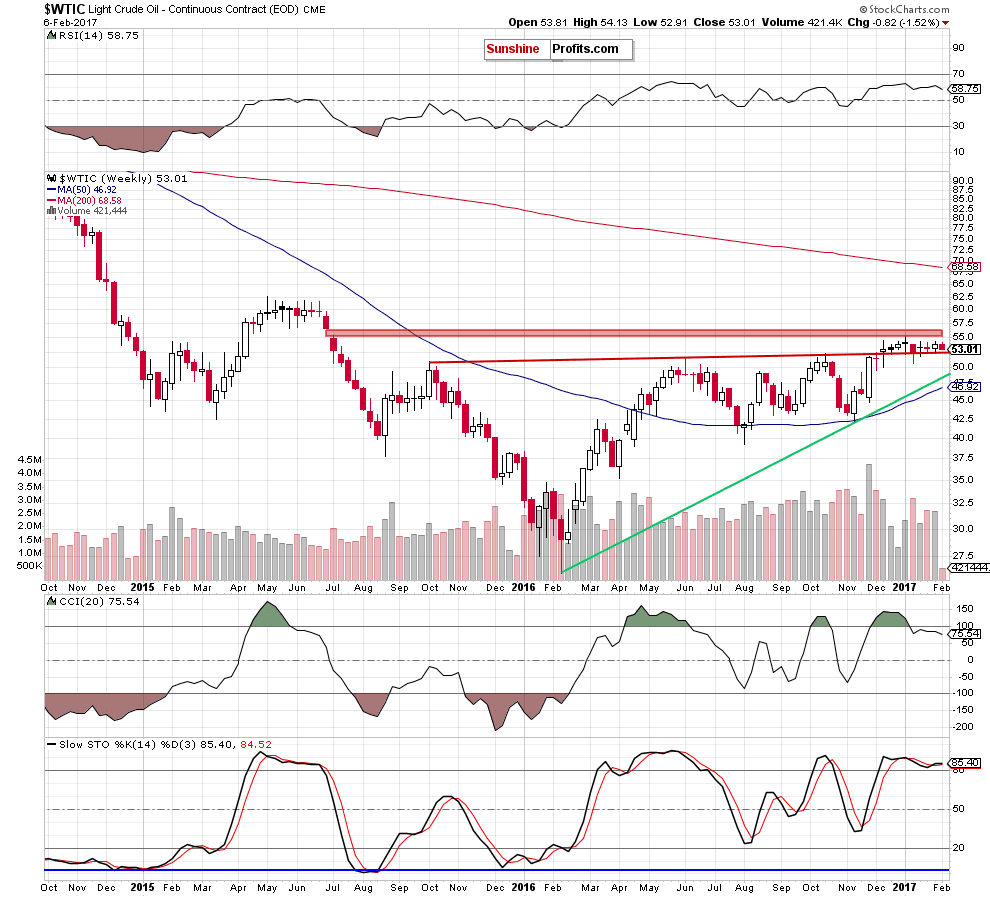
From the weekly perspective, we see that the overall situation in the medium term hasn't changed much as crude oil is still trading in a narrow range between the previously-broken long-term red line and the red gap, which continues to keep gains in check since the beginning of the year.
Will the very short-term picture give us more clues about future moves? Let's check.
Yesterday, we wrote the following:
(...) although crude oil moved a bit higher on Friday, the commodity is still trading in the blue consolidation under the red resistance zone. This means that as long as there is no breakout above the upper border of the formation a bigger move to the upside is not likely to be seen as the double (or even triple) top formation (created by the January 6, January 17 and Feb 2 peaks) continues to keep gains in check.
Additionally, the size of volume that accompanied Friday's increase was smaller than day earlier during the decline, which may be the first sign of oil bulls' weakness. (...)
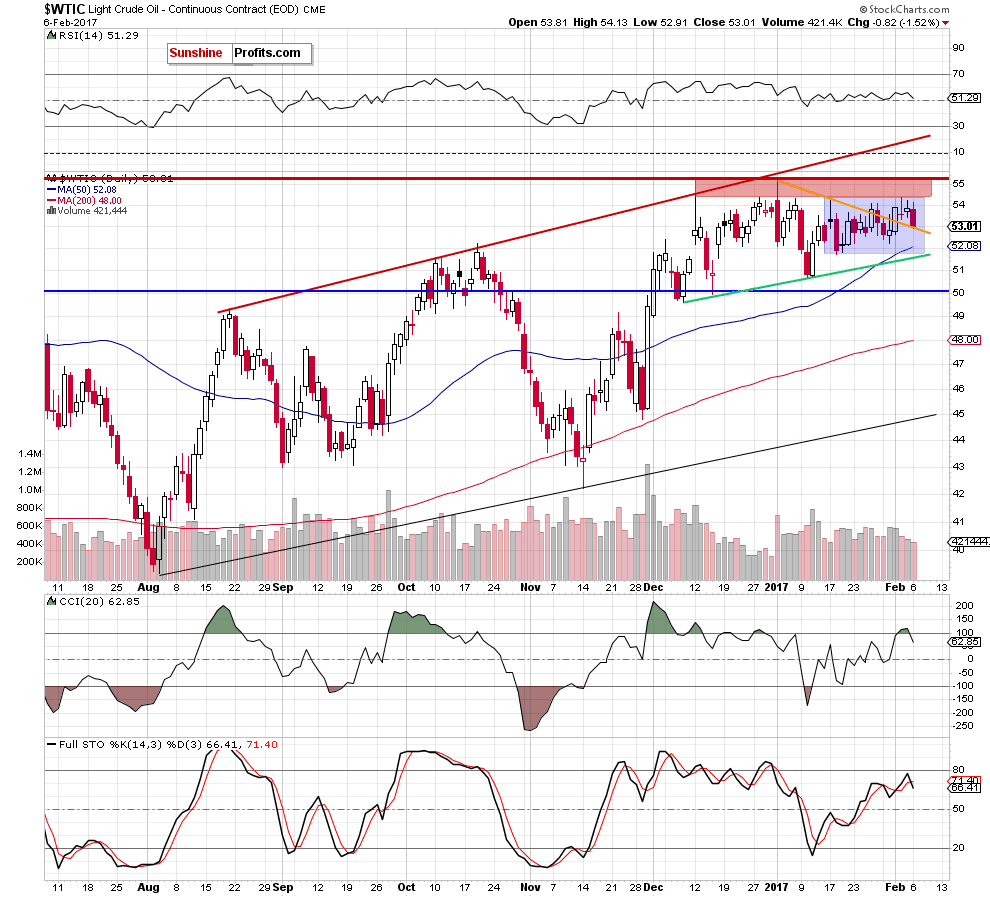
Looking at the daily chart, we see that the situation developed in tune with our yesterday's assumptions. Although light crude moved a bit higher after the market's open, oil bulls didn't manage to push the commodity above Friday's high, showing their weakness. As a result, their opponents took control over the market and crude oil dropped the previously-broken orange declining line, which serves now as the nearest support.
What's next? Although this short-term line could trigger a rebound, we should keep in mind that the daily CCI and the Stochastic Oscillator re-generated the sell signals, increasing the probability of further deterioration. If this is the case and light crude closes today's session under the orange line, we'll see an invalidation of the earlier breakout, which will give oil bears another important reason to act.
In this case, the next downside target will be around $51.70-$52.08, where the green support line based on the previous lows, the lower border of the blue consolidation and the 50-day moving average are.
Before we summarize today's alert, let's take a closer look at the relationship between gold and crude oil from the long-term perspective.
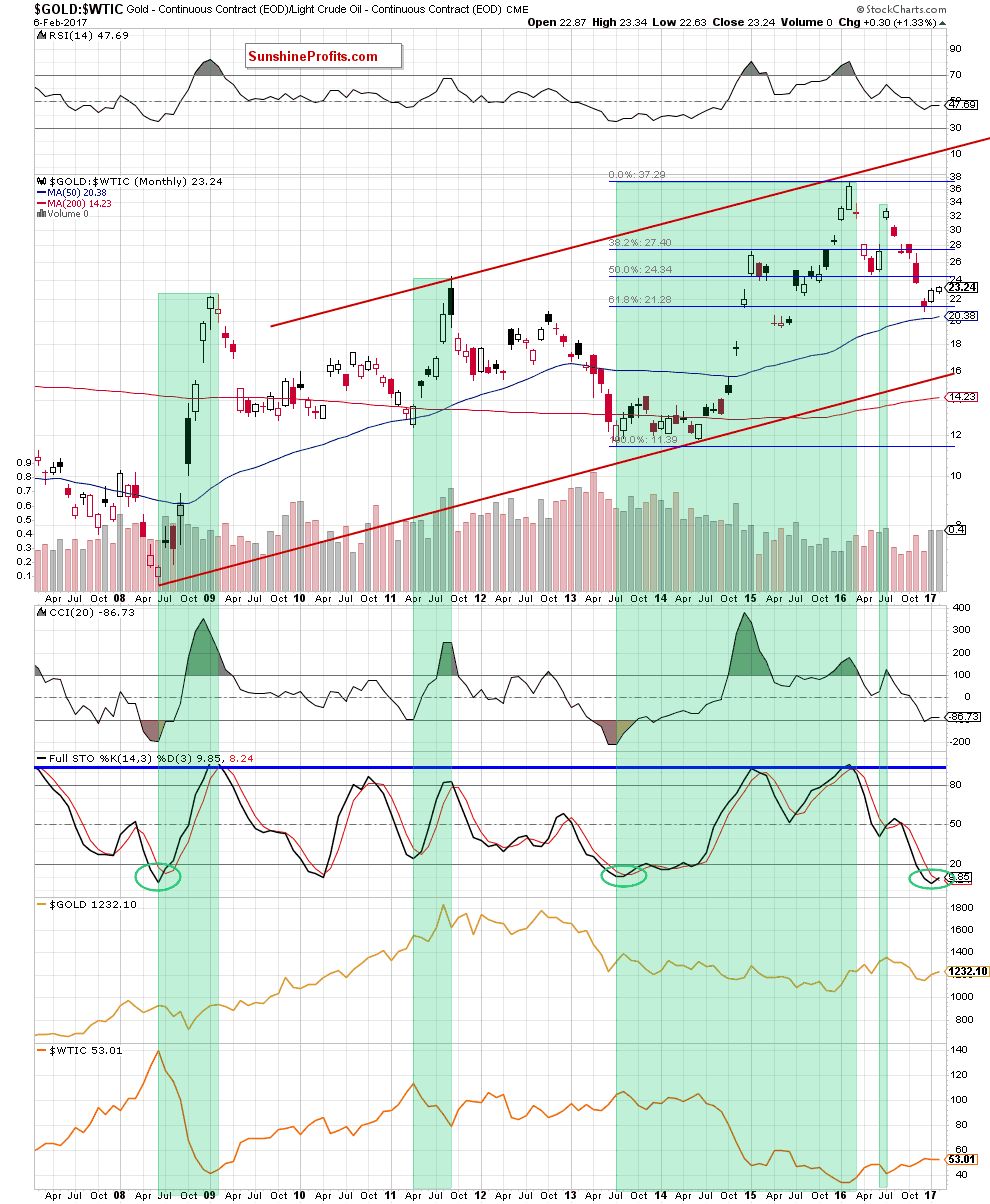
Looking at the above chart, we see that the gold-to-oil ratio slipped slightly below the 61.8% Fibonacci retracement (based on the entire July 2013-February 2016 upward move), but then reversed and rebounded. Thanks to this move the ratio invalidated the earlier small breakdown under this support level, which is a positive signal that suggests further improvement - especially when we factor in the current position of the indicators. As you see, the CCI and the Stochastic Oscillator generated the buy signals, which suggest that another attempt to move higher is just around the corner.
What does it mean for crude oil? As you see on the above charts, may times in the past higher values of the ratio have corresponded to lower prices of light crude. We have seen this strong negative correlation in the second half of June 2008, between April and September 2011, between July 2013 and February 2016 and also between June and July 2016 (we marked all these periods with green), which suggests that another (smaller or bigger) rebound of the ratio will translate into lower values of crude oil in the coming days or even weeks. Therefore, in our opinion, it's worth to keep an eye on the above chart to receive confirmation of the reversal.
Summing up, short positions continue to be justified as crude oil declined and came back to the previously-broken orange support line, which suggests that we'll likely see an invalidation of the breakout above it in the coming day(s). This scenario is also supported by the sell signals generated by the daily indicators and the current situation in the gold-to-oil ratio (if you want to know more about this and other interesting ratios, we encourage to sign up to our monthly Oil Investment Updates).
Very short-term outlook: bearish
Short-term outlook: bearish
MT outlook: bearish
LT outlook: mixed
Trading position (short-term; our opinion): Short positions (with a stop-loss order at $56.45 and an initial downside target at $45.81) are justified from the risk/reward perspective.


