PM's Times to Shine & Broad Markets Exhausted


Broad Markets on the Brink of Destruction
Monday the NASDAQ 100, SP500 and Dow all gapped higher with average volume above the recent consolidation levels. This appears to be the same setup we had on November 4th which was an exhaustion gap followed buy heavy selling down to new multi year lows. The chart below is of the SP500 ETF but the QQQQ and DIA all show the same price action. I'm not saying we are headed lower but caution must be taken here incase this play like it did a month ago.
SP500 Daily Chart

Volatility remains extremely high for equities, and holding cash is the best position at this time. Many traders are trying to pick the bottom and I recommend not playing that game. No one knows when and where a bottom will take place and with current volatility levels, you can lose 10% in one day. Let's not worry about missing the first rally, which will most likely be a sharp couple days straight up, but instead wait for a safe opportunity to put our hard earned money to work and continue to add to positions, as we get corrections.
Gold & Silver Outlook
Gold and silver closed lower on Friday. Gold had a long lower wick which generally indicates a small one or 2 day bounce could occur early next week and we got that today.
Gold & Silver's Long Term View
The 13 year gold miner's index chart shows a very large cup and handle pattern, which is a long term bullish pattern. Prices have eroded sharply this year, pulling the index back down to a major support level in October and November bouncing sharply higher off this level. We will keep our eye on this chart as the gold market unfolds.
Gold Miner's Index

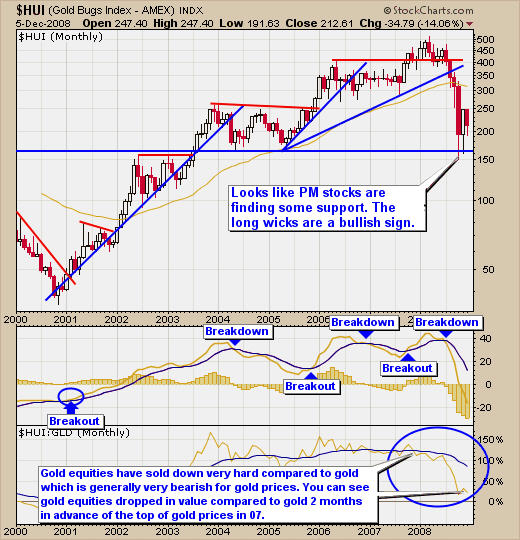
The Gold Bugs Index is a great indicator and generally I find it leads the price of gold for up to 4 days on the daily chart and up to 2 months on the monthly chart in some situations. The monthly chart of the HUI shows a very clear picture, as to where we stand for gold and gold equities. Again we have had a solid bounce off support, but what we really want to see here is the HUI to continue climbing faster than the price of gold, which will help confirm the bottom for gold prices. It is important to note that bear markets tend to pull all stocks down with it, which is why the ratio between the price of gold and gold stocks is so extreme. As sellers force stocks down in fear of losing more money, investors are slowly buying gold, as it is generally a safe haven during times like these providing some support for gold.
Gold Bugs Index - Monthly Chart of HUI
Gold & Silver's Short Term View
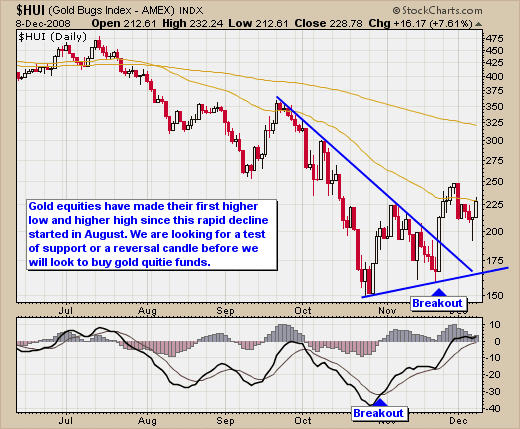
The daily HUI chart (gold Stocks) is something I pay close attention to, simply because gold stocks generally out perform the price of gold in rallies. As you can see in the chart below, the gold bugs index has made a higher low and a higher high. This is generally the first sign of a trend change. If the HUI does not break below our support trend line and we get a bounce, then we will be looking to buy gold equities and gold with low risk setups (risk under 3%).
Gold Bugs Index - Daily Chart
Short Term Gold Prices
The GLD exchange traded fund continues to struggle but looks to have formed a solid support level here. Although the price action of gold does not look very strong, it is a good sign to see gold equities showing strength, as they generally lead gold prices. If things work out in the next 1-3 weeks, we could be getting an intermediate buy signal for gold and gold stocks, but waiting for the market to prove it, is important as we do not want to invest only to see the price drop out from below us. The chart below shows the price of gold with our support level and also shows equities strength compared to the price of gold which is the bottom indicator on the chart.
Gold Prices - GLD Gold Exchange Traded Fund - Daily Chart

Gold Equities ETF - GDX Market Vectors Gold Miners
When trading gold stocks I prefer to trade the GDX exchange trade fund, because it provides excellent liquidity and performs very well with my trading model. It also holds high quality PM (Precious Metal) stocks. As you can see from the chart below, it looks very similar to the gold bugs index (HUI). Price action for this fund looks strong and if we get a low risk setup within in the next 1-3 weeks, we will put money to work with this fund.
GDX Exchange Traded Fund - Daily Chart

Silver - The Unpopular & Undervalued Metal
I have had my eye on silver for several years watching it go from $5 to over $20 within 5 years. That's an average of 60% per year return which is what opened my eyes to his shiny metal. Silver is a metal, which only a small group of investors actually own compared to its popular sister (Gold). That being said, most investors only jump on the band wagon after things become popular. Silver in my opinion could be the next really big winner. I do think Gold and Oil will be much higher in the long term, but will not offer the type of returns silver could yield us. So, this is why I am pointing out silver at these prices and looking for a low risk entry point. Silver is down over 50% from its highs and also looks to have found support at long term support levels.
Silver's Long Term View

Silver's Short Term View
As mentioned, above silver is an investment which I think could be the next popular metal and generate massive returns. Below is the daily chart of the silver (SLV) exchange traded fund showing that we are near a buy point if things continue to hold up.
SLV Exchange Traded Fund - Daily Chart

Gold and Silver Summary
Gold and Silver metals and equities are showing signs of a bottom and possible entry points for our money to be put to work for a counter trend trade.
Most commodities and equities are at levels which are very important to hold, and if these current prices do not hold up, we may see another substantial drop in almost every investment vehicle from commodities, equities, real estate and possibly the US dollar. I would expect gold to hold its value the most, if the broad markets crack and continue their death spiral lower. My main concern is that people will start to sell all their investments like gold and silver because they will need money to cover living and credit expenses. If this starts to happen, gold may not hold its value either.
That being said, we can short gold, silver and the markets so it's not that big of an issue in that respect. Also the markets are looking fairly strong as of Friday and a bottom may have been put in already. If we do get these setups you SHOULD invest in BOTH gold and silver, as a powerful diversification strategy. There certainly have been times when gold prices have held up better than silver and vice-versa. Hold both precious metals and you iron out some of the fluctuations inherent in the market while maximizing your returns.
The Oil Outlook
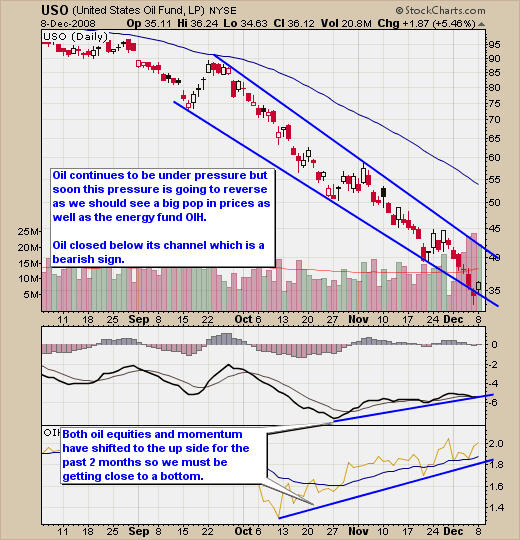
Crude Oil closed lower on Friday breaking down below its channel, posting a new low for the year and Monday popped higher back into its channel as it was very much over sold. Lower oil prices generally help boost the markets and allow everyone to pay a lot less at the pumps and reduce manufacturing and shipping costs so it would be nice to see things stay low for oil for a few months at least, but I am sure its headed much higher once OPEC cuts supply later this week.
You will notice on the chart below, that Oil equities have been holding their value compared to crude Oil which is the indicator at the bottom of the chart slowly climbing. I believe that's because stock valuations are at levels most of us have never seen before and may not ever see again. Most of these energy companies pay dividends and people are accumulating positions paying high yield rates. Stocks typically anticipate economic recoveries and turn 6-9 months in advance, so this is what we could be seeing here.
Oil prices move with daily/weekly demand levels and thus are a real-time indicator of supply vs. demand for the commodity. Oil prices could continue to slide to the $25 level, which was mentioned by several forecasters this week, as demand continues to deteriorate.
I currently do not see any near term setups in Oil or Oil equity funds, and the chart below shows how momentum for Oil and Oil equities are trending up, while Oil continues lower. This is a bullish sign for crude but I want to see some foundation building before we put money into energy. I'm thinking we are getting close to a bottom but generally 75% of the move comes during the last 25% of the time. Trading low risk setups is important when trading in high volatility markets like this.
Crude Oil Fund - USO Exchange Trade Fund>
Oil Summary
We continue to wait for the Oil industry to smooth out and provide a solid foundation for a possible short play or a long position. Doing anything at this level is simply chasing and generally a losing position.
News Weeks Game Plan
The broad market looks fairly strong, as it closed higher on Friday at the top of its trading range. If we do get a pop next week in equities, then our PM (precious metal) equities funds should make substantial moves. I will send out daily updates to keep everyone up to speed in case we have some signals, and to keep in touch answering all your questions.
For more information, questions or to receive my weekly trading reports and trading signals please send me an email at: [email protected] website: www.TheGoldAndOilGuy.com

Chris Vermeulen has been involved in the markets since 1997 and is the founder of Technical Traders Ltd. He is an internationally recognized technical analyst, trader, and is the author of the book: 7 Steps to Win With Logic
Through years of research, trading and helping individual traders around the world. He learned that many traders have great trading ideas, but they lack one thing, they struggle to execute trades in a systematic way for consistent results. Chris helps educate traders with a three-hour video course that can change your trading results for the better.
His mission is to help his clients boost their trading performance while reducing market exposure and portfolio volatility.
He is a regular speaker on HoweStreet.com, and the FinancialSurvivorNetwork radio shows. Chris was also featured on the cover of AmalgaTrader Magazine, and contributes articles to several financial hubs like MoneyShow.com.
More from Gold-Eagle


