The Power Of The 10-Year Cycle


Here we are again approaching another 10-year cycle peak. The last such peak was in 1999 while the most recent 10-year cycle bottom was in 2004. We wrote extensively on both episodes at the time and the 10-year cycle is one of our favorites. It's what I like to call the "slam dunk" cycle since among all the yearly Kress cycles, the 10-year cycle at its peak and bottom phase can almost always be used for profitable trading/investing almost by itself.
It will be sad to wave goodbye to our friend, the 10-year cycle, in a few weeks. After the 10-year cycle peaks it will be up to the 6-year cycle to provide any longer-term support between now and 2012 when the final "hard down" phase of the Kress 120-year Grand Super Cycle begins. In this commentary we'll focus on the remaining portion of the 10-year cycle and how it can still be used to good effect by investors between now and year-end. That the broad market has benefited from the peaking 10-year cycle is obvious and needs no elucidation. Clarification is needed, however, within the scope of the Kress cycles to tell us what we can expect from the market from now until year's end based on cyclical comparisons.
The year 1979 is the closest parallel to 2009. The 6-year cycle bottomed in 1978 which meant the stock market had the benefit of a newly rising 6-year cycle in 1979. The 10-year cycle peaked around the early part of October in '79. This becomes apparent in the daily chart of the S&P 500 Index (SPX) shown below.
The 10-year cycle peaking in October '79 triggered a sharp decline that saw the SPX retrace much of its gains over the prior four months. Most of this sharp decline took place within the short space of three weeks, which is typical of a major cycle peaking. Following the October mini-crash, the S&P rallied in November and December and almost recovered its losses from October and closed just under the high for the year 1979. The NASDAQ Composite Index actually had a much stronger recovery following the 10-year cycle peak in October '79 as shown here.

By comparison, the most recent 6-year cycle bottomed last year, which means the newly formed 6-year cycle is up in 2009. This ascending 6-year cycle has combined with the forceful momentum of the peaking 10-year cycle to create one of the strongest recovery rallies in decades in percentage terms.
The next cyclical parallel to our time takes us back to the 1948-1949 period. This was the other time in the current 120-year cycle that the 6-year cycle bottomed in the eighth year of the decade (1948) while the 10-year cycle peaked in late 1949. Even more significantly, 1949 is analogous to 2009 in that it was five years from the 60-year cycle bottom of 1954. This year is also five years from the 60-year cycle bottom of 2014 with the 60-year cycle the half-cycle components of the 120-year Grand Super Cycle.
So how did 1949 end up for the stock market? While the first half of the year was down, the latter half of the year was up steadily with the market making a high for the year in December and ending on a positive note.
The prior occurrence of the 6-year/10-year cycle configuration was the 1918-1919 period. The year leading into 1918 was not only the final "hard down" phase of the 6-year cycle but also of the more important 24-year cycle, which also bottomed in 1918. The Panic of 1917 was the result; its modern day parallel was the credit crisis of 2007-2008. The 6-year cycle bottomed in 1918, which effectively ended the panic, while the 10-year cycle peaked in 1919. The year 1919 saw a tremendous rally in the stock market, culminating in the highest level for stocks in the century to date. The 10-year cycle peaked late in the year 1919, as per normal, producing a correction but still enabling stocks to close with a gain for the year.
The year that comes closest of all to approximating to our time is the 1888-1889 period. This is the historical period exactly in alignment to where we stand in the 120-year cycle, for in 1889 - much like 2009 - the market was five years away from both the 60-year and 120-year cycle bottoming. The 10-year cycle peaked in 1889 while the 6-year cycle had bottomed the previous year, therefore the 6-year/10-year cycle configuration was identical to ours within the same context in the last 120-year cycle. The year 1889 was a gainer year for stocks as reflected by the Axe-Houghton Industrial Stock Price Average. According to this index, stocks made their highs for the year near the end of 1889.
In the preceding overview we have looked at only those years in the 120-year cycle when the 10-year cycle was peaking (which always occurs in the ninth year of the decade) and where the 6-year cycle had bottomed the previous year, much like the 2008-2009 experience. If we look at the most recent 10-year cycle peaks of the last 30 years regardless of where the 6-year cycle was headed, we find that the years 1989 and 1999 were both similar in that the 10-year cycle peak produced a discernable decline in the stock market, yet the market bounced back strongly in the final two months of the year. The reason for this is that while the 10-year cycle may have peaked around late September/early October in most of those years, the residual upside momentum from that cycle still carried over into year-end.
Also, in most years when the 10-year cycle peaks one or more of the dominant weekly Kress cycles tends to bottom shortly after the 10-year cycle peaks, creating a strong tendency for the stock market to bounce off the declined created by the 10-year cycle peak. As history clearly shows, the stock market tends to close at or very near its high for the year in most 10-year cycle peak years. The implication is for stocks to enjoy a strong fourth quarter this year in spite of widespread fears of another bear market to begin.
More importantly for our present discussion is the state of the economy in light of the peaking 10-year cycle. The S&P 500 bottomed nearly six months ago, thus ending a 2-year-plus bear market. The old bromide about the stock market preceding turns in the economy by 6-9 months has consistently held true and this time should prove to be no exception. The upward bias created by the 10-year cycle peak this year is pointing to improved business conditions and is one reason for expecting the economy to outperform the consensus in the fourth quarter.
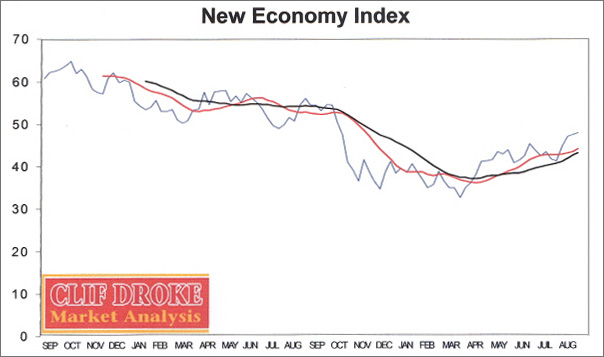
To get a lead on the interim direction of the economy, we use the New Economy Index (NEI) to track the state of the retail economy. The most sensitive retail stocks (bricks and mortar, transportation and Internet) are averaged to provide the weekly reading in the NEI, which points to the direction the economy is headed. Using the important 12-week and 20-week moving averages, we have a strong indication that the economy will show improvement between now and year-end, and the economic numbers should start reflecting this improvement by the end of the fourth quarter.
The 10-year cycle told us to expect a strong recovery in 2009 -- and to date it has performed according to the historical script. The analysis of prior 10-year cycle peaks also gives us reason for an overall positive performance in the fourth quarter, notwithstanding the bumpiness which is always felt by the actual peaking of the 10-year cycle near the end of the third quarter.
Clif Droke is the editor of the three times weekly Momentum Strategies Report newsletter, published since 1997, which covers U.S. equity markets and various stock sectors, natural resources, money supply and bank credit trends, the dollar and the U.S. economy. The forecasts are made using a unique proprietary blend of analytical methods involving cycles, internal momentum and moving average systems, as well as investor sentiment. He is also the author of numerous books, including "Stock Trading with Moving Averages." For more information visit www.clifdroke.com


